The price is ready for a big descend
After a strong ascend, USD/SEK is now showing trend reversal signals. After touching 0.618 of Fibonacci retracement, USD/SEK entered descending phase and now, the ascending trendline is broken. Ichimoku cloud is below the price and RSI is in neutral area. MACD is showing descending phase and MA 100 is below the price too. A descend is expected in the next few days.
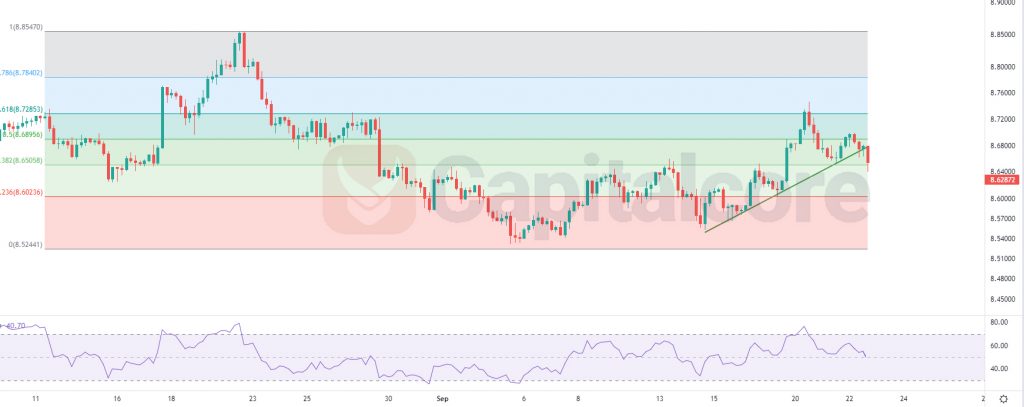
Chart Notes:
• Chart time-zone is UTC (+03:00)
• Candles’ time-frame is 4h.
The strongest resistance level around is at about 8.72 and the strongest support is at about 8.6. A decline is expected after a possible retest of the broken trendline. sellers can target 8.6 as the first TP and in case this area is broken, 8.55 would be the next goal of the descending wave. If the price comes back on top of the previous broken trendline, buyers can expect a bullish trend to follow. In this case the first expected target of the ascending wave would be 8.74 and the next target would be 8.85. In daily time frame, the price is inside Ichimoku cloud, the flat bottom line of the cloud could be the ultimate destination of the ascending wave. The general look of the chart is bearish and opening long positions are highly risky unless you are planning to close your position below an hour.
• DISCLAIMER: Please note that the above analysis is not an investment suggestion by “Capitalcore Ltd”. This post has been published only for educational purposes.