Stay alert for a descending signal
USD/SEK started an ascending wave on 10th of November 2021 and has been able to ascend about 16.4% until now. The ascending slope of the price line is increasing. USD/SEK is in the overbought zone right now and trend reversal is about to take place. Traders should keep a sharp eye on the chart to hunt descending signals.
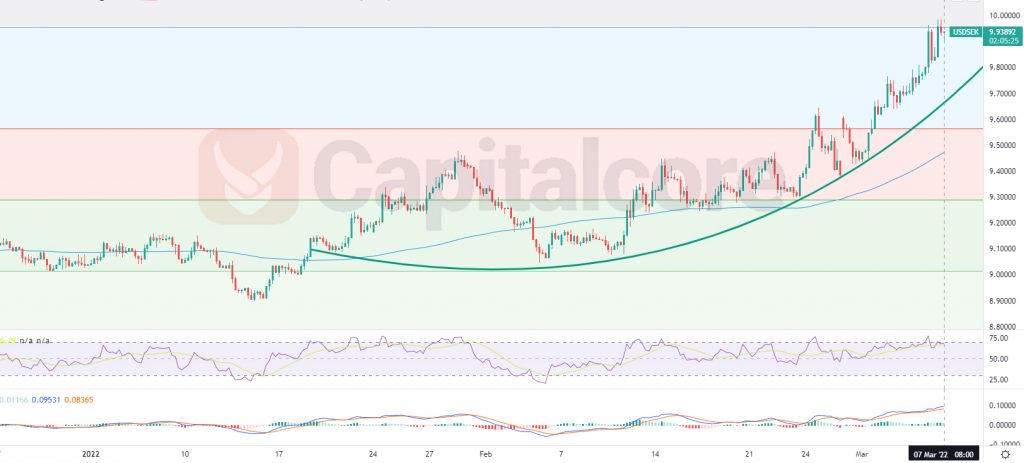
Chart Notes:
• Chart time-zone is UTC (+03:00)
• Candles’ time-frame is 4h.
USD/SEK price on the chart is on 9.93891 at the moment and is pretty close to level 0.786 of the Fibonacci retracement, which lays around 9.96. The green line on the chart shows the ascending wave that is increasing in slope. The price line is distancing itself from MA 99 and there is not any strong support level below the price line. RSI is almost on 70, is showing over buying on USD/SEK and is also issuing negative divergence signal. MACD is showing ascending wave on going but it is also showing negative divergence. Traders can be waiting for a any descending pattern or signal on the price chart to trigger their short positions. The target for the descending wave could be considered on 9.6 and 9.3 .
• DISCLAIMER: Please note that the above analysis is not an investment suggestion by “Capitalcore Ltd”. This post has been published only for educational purposes.