An ascending phase looks to be close
USD/SEK started an ascending wave on the first of November. The price could ascend up to almost 8% until 26th of November and then started a sideway range. The price line at the moment is smoothly above level 0.236 of the Fibonacci retracement and as it looks, a descending wave looks to be close.
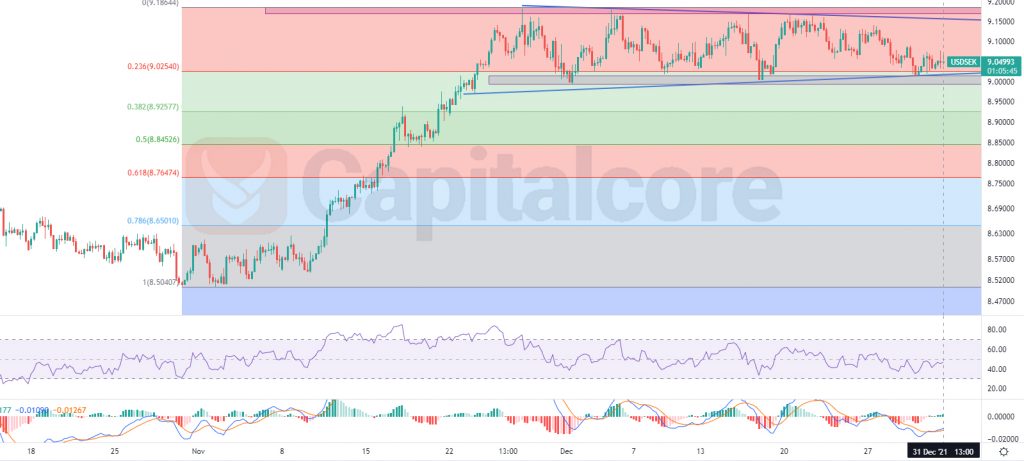
Chart Notes:
• Chart time-zone is UTC (+03:00)
• Candles’ time-frame is 4h.
The price at the moment is almost on 9.05 and is moving within a short term descending channel. The most important support level around the price is on 8.9922 – 9.0145; This area equals to level 0.236 of the Fibonacci retracement, has supported the price line several times and has not been broken yet, therefore it is of high importance. The resistance levels above the price are: a dynamic resistance, shown by a blue line above the price line and also the area between 9.17- 9.188, which has been able to block ascending waves several times. RSI is showing negative divergence and is almost on 453. MACD is showing a weak ascending leg. In case the price line breaks below the support level, sellers can be expecting a descending phase, heading to 8.93 .
• DISCLAIMER: Please note that the above analysis is not an investment suggestion by “Capitalcore Ltd”. This post has been published only for educational purposes.