The price line is on a strong resistance
USD have gotten stronger against SEK in the past few days. On the Chart the price line is moving within an ascending channel. Right now the the price has reached an important resistance level. The overall look of the chart is still bullish, we should be waiting to see the next move of the price.
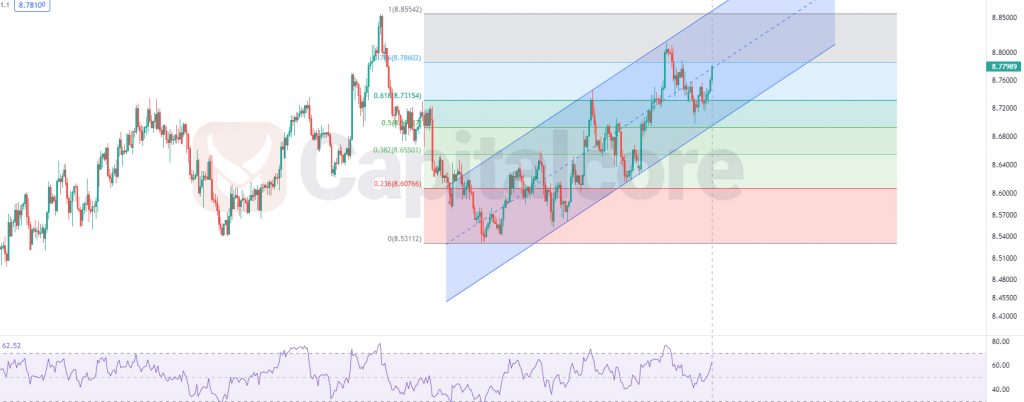
Chart Notes:
• Chart time-zone is UTC (+03:00)
• Candles’ time-frame is 4h.
The strong resistance on 8.78 – 8.79 could push the price live down a couple of times before. This time the price is again touching this area. RSI is showing 65 This area is level 0.786 of the Fibonacci retracement of the previous strong descending wave. in case this area is broken, bulls can be expecting to see the price at 8.81 and the next target can be 8.85. On the other hand if the resistance level can push the price line down once more, sellers can target 8.73 as the first TP and the next one can be 8.7. At any point breaking bellow the channel would be a good entrance point for sellers.
• DISCLAIMER: Please note that the above analysis is not an investment suggestion by “Capitalcore Ltd”. This post has been published only for educational purposes.