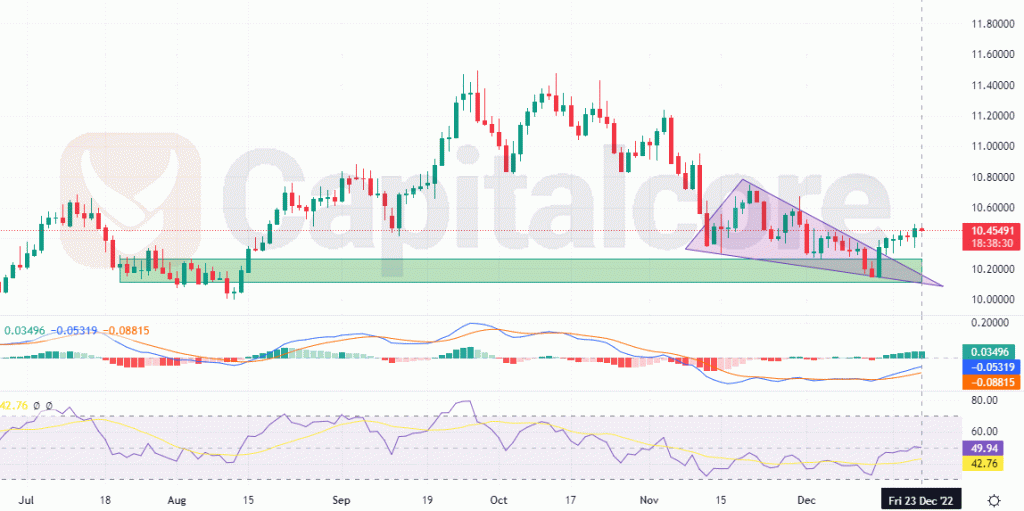
The price line has reacted to the support zone
After a significant bearish wave, the price line on USD/SEK price chart reached our to a strong support zone and after a bullish divergence on both MACD and RSI indicators, the price line is now reacting to this support zone, making the probability of an upcoming ascending wave even higher.

Chart Notes:
• Chart time-zone is UTC (+03:00)
• Candles’ time-frame is 4h.
Since October 13th, 2022, the price line on the USDSEK price chart has been moving in a bearish wave; this bearish wave resulted in a loss of value of 10.6% up to December 5th, when the price line began to approach a solid support level. On the chart, this support level is marked by a green area. The chart shows a falling triangle, which is highlighted in light purple. Buyers can anticipate the price line retest of the green zone as MACD and RSI are sending bullish signals. From there, they can place long positions that will take them to the supply levels at 10.67750 and 10.75000.
• DISCLAIMER: Please note that the above analysis is not an investment suggestion by “Capitalcore Ltd”. This post has been published only for educational purposes.