The ascending trend line is broken.
The price line on USD/SEK chart, started an uptrend on 4th of November and could ascend up to 7.7%. The price then formed a double top pattern on 9.184 and started to descend smoothly. Right now the price is on an important support level and traders should keep an eye on it.
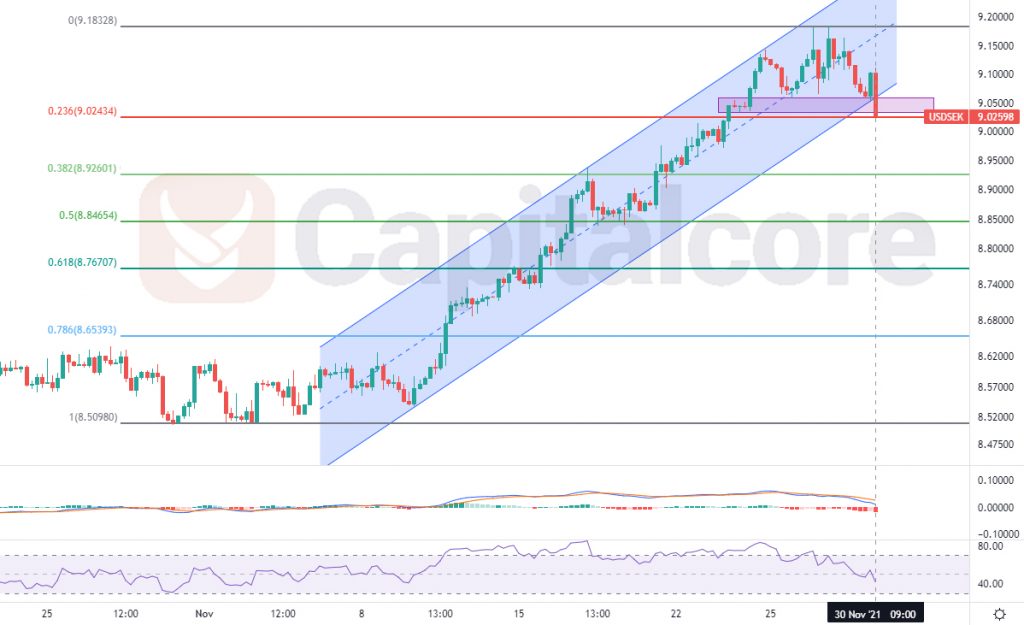
Chart Notes:
• Chart time-zone is UTC (+03:00)
• Candles’ time-frame is 4h.
At the moment the price is on 9.026 which equals to level 0.236 of the Fibonacci retracement as well as the bottom line of the ascending channel. RSI is showing almost 47 and MACD is showing a strong descent. The overall look of the chart is bearish and therefore sellers can be waiting for a break below the channel and a possible retest of the base line of the channel to open a trade. In this case the first TP for bears would be level 0.618 of the Fibonacci retracement which would be 8.929, and the next TP could be set on 8.85 which is level 0.5 of the Fibo. On the other hand, if the support level can pump the price inside the channel once more, buyers can target 9.18 and 9.37 for their TPs.
• DISCLAIMER: Please note that the above analysis is not an investment suggestion by “Capitalcore Ltd”. This post has been published only for educational purposes.