The price line broke above the descending trend
USD/SEK had been moving within a descending trendline since 26th of November 2021; Finally on 20th of January, 2022 the price line could break above the trendline and at the moment, the pair is having a retest of the broken area. The overall look of the chart is bullish and long positions have a bigger chance of winning.
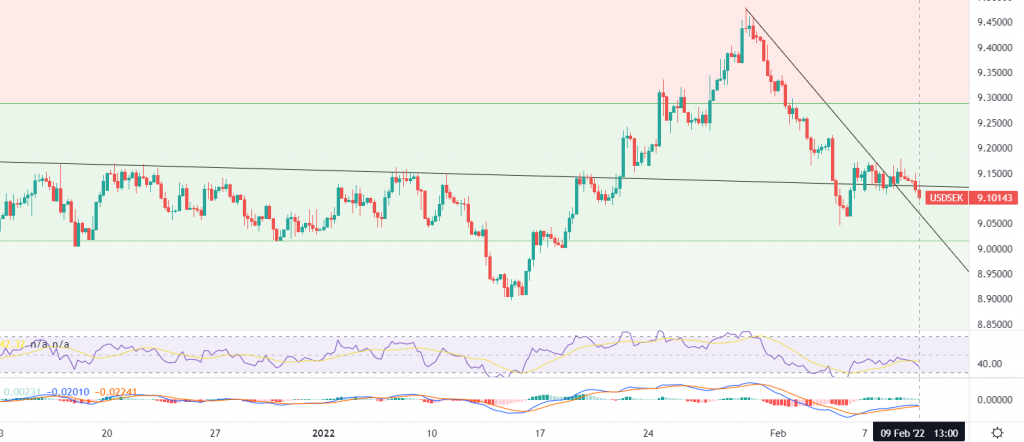
Chart Notes:
• Chart time-zone is UTC (+03:00)
• Candles’ time-frame is 4h.
The price on USD/SEK at the moment is on 9.10143 and is having a retest of the broken trend line. The trendline is shown as a black line on the chart. There is also another support level below the price line which would be level 0.382 of the Fibonacci retracement; this level equals to 9.02 on the price chart. RSI is showing almost 40 and MACD is showing a weak ascending trend. Traders can be waiting for a signal to indicate the end of the descending wave and then they can enter the market; The descending wave could continue up to level 0.38 of the Fibonacci retracement. If the Fibonacci level can pump the price once more, the possible targets for the ascending wave could be considered on 9.325 and 9.6. Please consider that in case the price line breaks the Fibonacci level significantly, the chance for an ascending wave to occur, would highly reduce.
• DISCLAIMER: Please note that the above analysis is not an investment suggestion by “Capitalcore Ltd”. This post has been published only for educational purposes.