- October 27, 2022
- Category: Market News
USD/SGD is being oversold
The price line on USD/SGD price chart started a descending wave on 28th of September 2022. This wave caused the price to experience about 3.2% loss. Some indicators are issuing bullish signals and the price line is approaching a strong support level; a bullish wave could be expected.
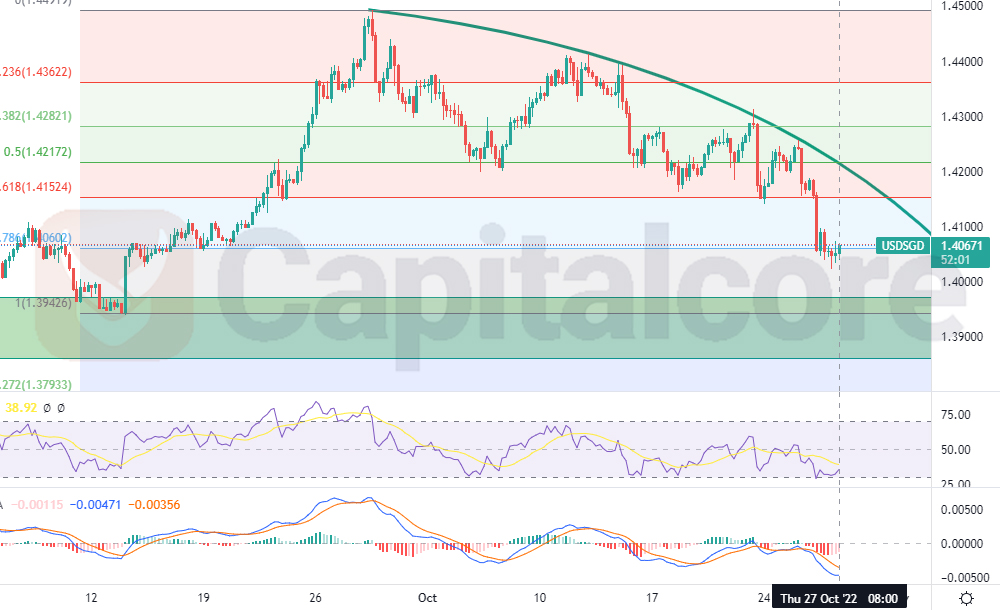
Chart Notes:
• Chart time-zone is UTC (+03:00)
• Candles’ time-frame is 4h.
The price line on USD/SGD price chart is currently showing 1.40671, that would be located just above level 0.786 of the Fibonacci retracement on the previous ascending wave. Other Fibonacci levels are also reflected as colorful horizontal levels. The green curved line above the price line indicates the trend line which has caused the current bearish wave. RSI is currently almost on 35 and MACD is showing potential for commencement of a bullish wave. As the descending slope of the chart is increasing, it could be concluded that USD/SGD is being oversold. Traders can expect the price line to through another descending leg, and after the price reached out to 1.39800, they can enter long positions and target 1.41500 and 1.42200 . Also consider that, in case the price line falls below 1.38620, the bullish chance would highly reduce.
• DISCLAIMER: Please note that the above analysis is not an investment suggestion by “Capitalcore Ltd”. This post has been published only for educational purposes.