The price line on a strong support zone
USD/SEK price line started a sharp descending wave on 19th of April 2022 at 8 o’clock in the morning, the price line dumped almost 2% in 29 hours. The price line now is on a strong support line which has been able to pump the price a couple of times before, and a bullish phase is possible to take place shortly.
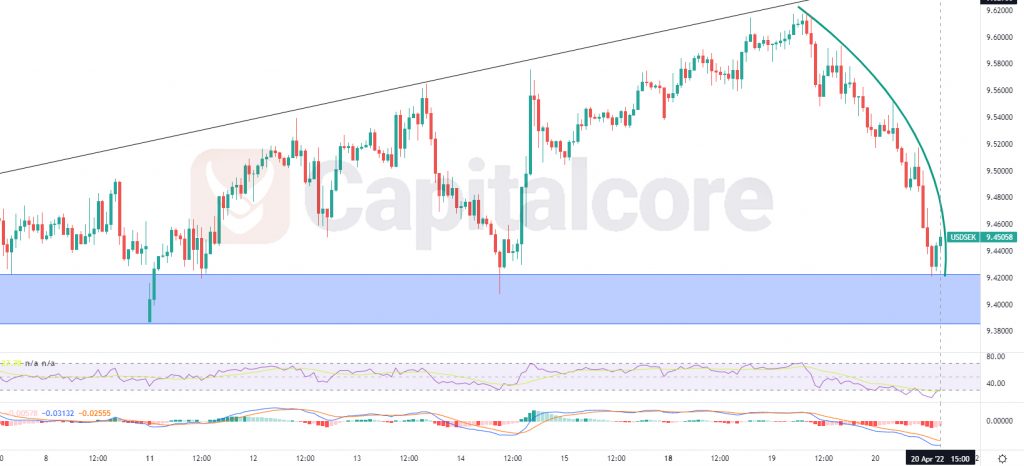
Chart Notes:
• Chart time-zone is UTC (+03:00)
• Candles’ time-frame is 1h.
The price line at the moment is almost on 9.45, which would be just above the support zone. This support zone is indicated as a blue box below the price line. As you can see, this area has already reversed bearish waves several times. The green line on the chart indicates the increasing descending slope on the bearish trend. This trend line is getting into Infinite slope, which means the pair is being oversold. RSI also shows over selling on this area and MACD is showing weakness in descending trend. Traders can wait for the price line to break out of the green line and then on the retest of the blue zone, the can enter long positions. The First target for the outcoming trend, can be considered on 9.515. Next targets can be set on 9.6 and 9.75.
Note that losing the blue zone could be followed by a strong descending wave for the pair.
• DISCLAIMER: Please note that the above analysis is not an investment suggestion by “Capitalcore Ltd”. This post has been published only for educational purposes.