Bullish trend seems to be ending
USD/ZAR started a bullish trend on 7th of Jun 2021 and could ascend more than 22.4% until 26th of November 2021. The price line then started a descending trend and after retesting the bullish trend line, the price line finally broke below this trend line on 16th of February.
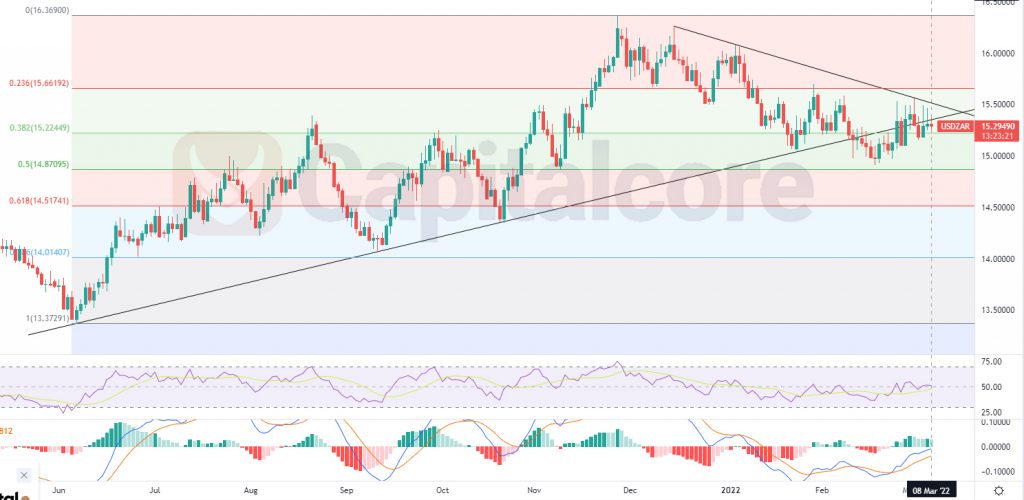
Chart Notes:
• Chart time-zone is UTC (+03:00)
• Candles’ time-frame is daily.
On USD/ZAR price chart, the price is on 15.295 at the moment which would be just below the dynamic support zone, which is indicated as a black line on the chart; this zone was formed during the previous ascend on USD/ZAD. The black line above the price line indicates the currently-formed descending trend line. The most important support line below the price line would be just around 15.2255, which equals to level 0.382 of the Fibonacci retracement. RSI is almost on 50 and in neutral territory. MACD is showing weakness in ascending trend. The overall look on USD/ZAR price chart is bearish. Traders can be waiting to see a descending phase heading to 14.87 and 14.5165. Please note that in case the price line cab break above the descending trend line, this theory would lose potential to take place.
• DISCLAIMER: Please note that the above analysis is not an investment suggestion by “Capitalcore Ltd”. This post has been published only for educational purposes.