The resistance level does not seem breakable
USD/ZAR started a bullish rally on 13th of April and could ascend up to more than 12% in almost 20 days; until 3rd of May 2022, when the price line reached to a strong resistance level on weakly frame. The price line then went through a correction phase and right now after another retest of the resistance level, USD/ZAR looks to be starting a bearish phase.
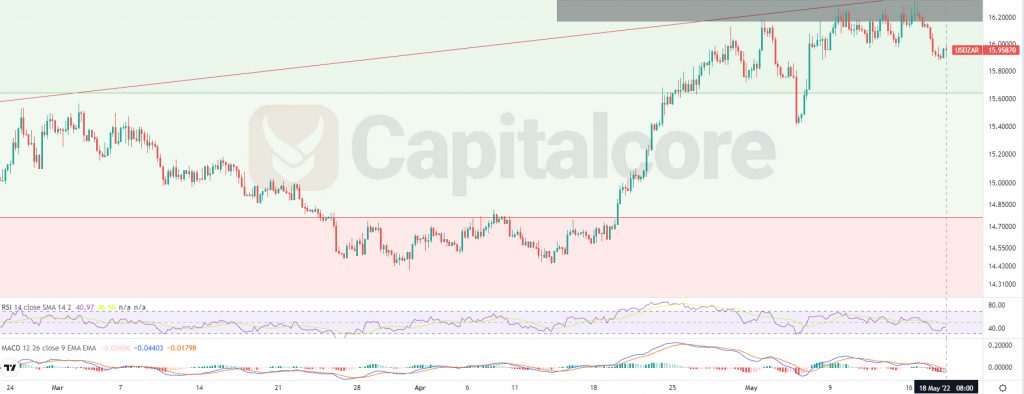
Chart Notes:
• Chart time-zone is UTC (+03:00)
• Candles’ time-frame is 4h.
The price line at the moment on USD/ZAR price chart is showing 15.9587 at the moment, which would be just below the resistance level and above level 0.382. The gray zone on the chart indicates the strong resistance level. which also equals to level 0.5 of the Fibonacci retracement on the previous major descending wave on weekly time frame. The ascending red line indicates the trend line which has formed the current ascending wave; as you can see, the trend line is broken and a retest is being made to this area. The red zone below the price line indicates level 0.236 of the Fibonacci retracement. Traders can be waiting for the price line to touch the resistance level once more and then they can enter short positions; the target for the short wave could be considered on 15.655 and 14.766.
• DISCLAIMER: Please note that the above analysis is not an investment suggestion by “Capitalcore Ltd”. This post has been published only for educational purposes.