The bearish phase seems to be starting
The price line on USD/ZAR started moving bullishly on February the second 2023, after touching a support level at around 17.07100. The frog jumps of the price line got lower over time, as the price line approached the resistance level at 18.00000. Different indicators are now issuing bearish signals and the price on USD/ZAR is highly potential to descend.
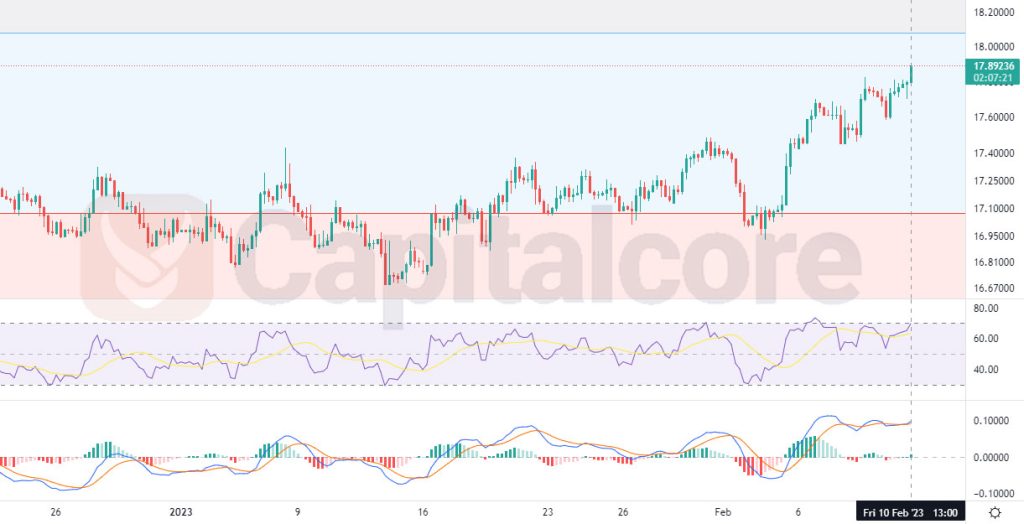
Chart Notes:
• Chart time-zone is UTC (+03:00)
• Candles’ time-frame is 4h.
The price on this pair is currently on 17.89236, moving towards the resistance level, located around 18.00000. This resistance level is expected to include a high volume of sell positions as it coincides level 0.786 of the Fibonacci retracement on the previous bearish wave and also is considered a round number. RSI is issuing negative divergence signal and are is MACD histograms. The bearish wave seems to maintain, only until it touches the blue line above it, which reflects the Fibonacci level; there sellers should keep a sharp eye on shorter time frames to indicate any bearish trigger being ignited. The price line then could enter a descending wave, heading to Level 0.618 of the Fibonacci retracement, located at 17.07700.
• DISCLAIMER: Please note that the above analysis is not an investment suggestion by “Capitalcore Ltd”. This post has been published only for educational purposes.