- May 6, 2022
- Category: Market News
The resistance level is being tested once more
USD/ZAR started climbing an ascending channel since 7th of June 2021. On 26th of November 2021, a climax was formed on USD/ZAR price chart, the price line then went through a correction phase and fell to the bottom line of the ascending channel. Currently the price has risen to the midline of the channel via a sharp ascending wave and is now potential of making another sharp move.
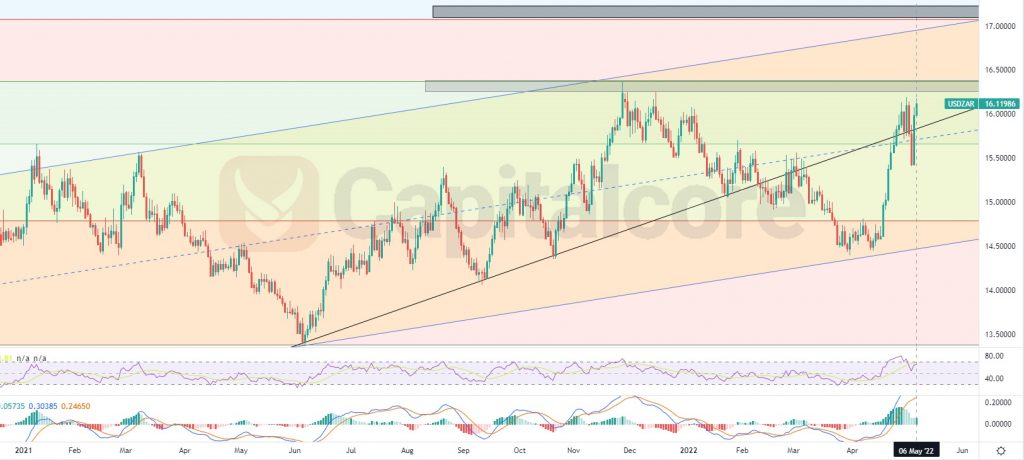
Chart Notes:
• Chart time-zone is UTC (+03:00)
• Candles’ time-frame is daily.
On USD/ZAR price chart, the price line is currently on 16.11986, Which would be just above the midline of the channel. A little above the price line, lays the resistance of level 0.5 of the Fibonacci retracement on the previous major descending wave. RSI is showing negative divergence and MACD is showing weakness in the ascending wave. The black line on the table is indicating an ascending trend line which has been broken by the price line; the price line is having a retest of this level once more. Traders can be waiting for the price line to ascend to level 0.5 of the Fibonacci retracement and then they can enter short positions, heading to the base line of the channel. The targets for bears, can be set on level 0.382 and 0.236 of the Fibonacci retracement at 15.67 and 14.8.
Please note that this analyses is of value as long as the price line has not broken above the gray resistance zone at level 0.5 of the Fibonacci retracement.
• DISCLAIMER: Please note that the above analysis is not an investment suggestion by “Capitalcore Ltd”. This post has been published only for educational purposes.