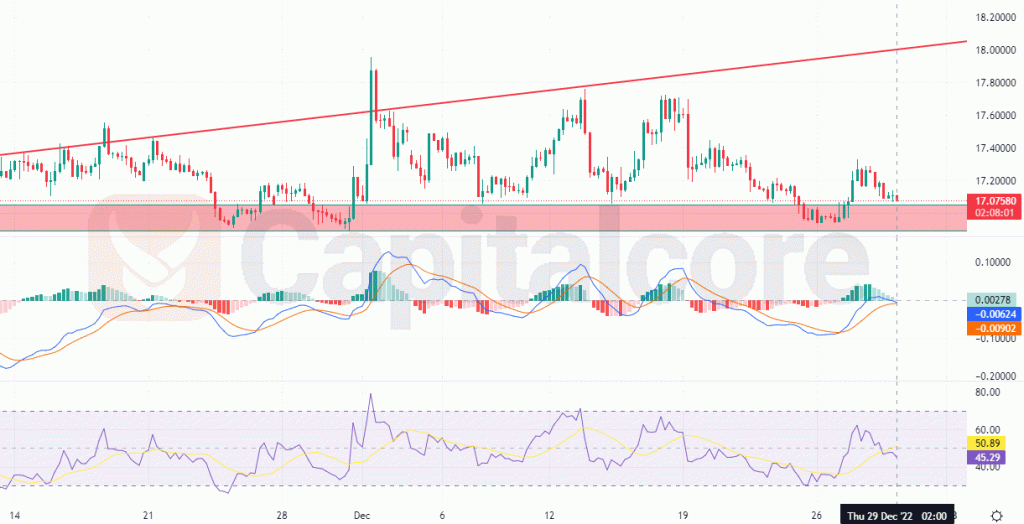
The bears seem to be taking control
The price line on USD/ZAR price chart could finally break below the bullish trend line that started forming on April the 19th. The price line is now on a support zone which does not seem to be able to hold the price line. Several indicators are issuing bearish signals and sellers are looking to be taking over the market.

Chart Notes:
• Chart time-zone is UTC (+03:00)
• Candles’ time-frame is 4h.
The red ascending line on the chart indicates the long-term dynamic support which is already broken and several pull backs have been made to it. The red zone below the price line indicates the support zone which is not expected to be able to pump the price line any further as the demands are looking to be too few in this area. MACD histograms have turned light red, but a negative divergence signal has been issued previously and has not affected the price line so far. RSI is on a bearish trend and is forming lower picks each time going on a climax. Traders can wait for the price line to break below the static support line; then they can enter short positions heading to the support zone on 16.48240 and 15.85100 after that. Also consider that entering a short position before the support zone is broken, would not be a wise move to make.
• DISCLAIMER: Please note that the above analysis is not an investment suggestion by “Capitalcore Ltd”. This post has been published only for educational purposes.