An ascending leg can be expected
The price line on USD/ZAR price chart started an upward trend in early August, within which the value of this pair could ascend up to more than 13%. The price line is now approaching the bottom line of this channel and another ascending leg can be expected.
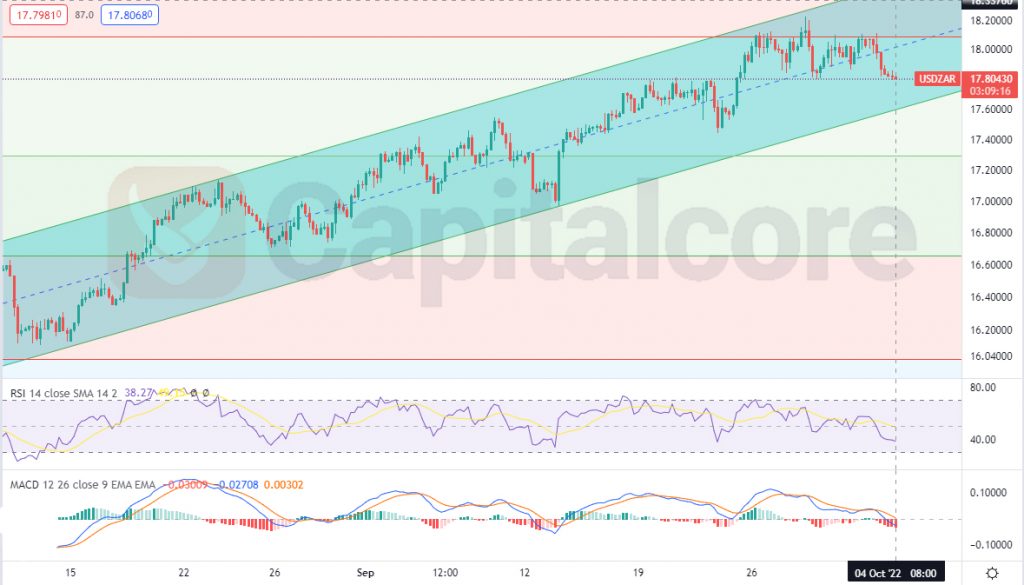
Chart Notes:
• Chart time-zone is UTC (+03:00)
• Candles’ time-frame is 4h.
The price line on USD/ZAR price chart is right now indicating 17.8043, where is located almost in the middle of the ascending channel. MACD is showing strong bearish leg on going. The horizontal levels are indicating Fibonacci retracement levels. The blue ascending channel, indicates the pathway through which the ascending wave has been formed; it has already receded several reactions to the middle, bottom and top line of the channel. RSI is approaching to a support zone. Traders can expect the price line to have another retest of the bottom line of the channel, there the can enter long positions. The target for the ascending wave could be considered on the top line of the channel and the Fibonacci levels at 18.023510 and 18.55314.
• DISCLAIMER: Please note that the above analysis is not an investment suggestion by “Capitalcore Ltd”. This post has been published only for educational purposes.