The price is on the mid line
USD/ZAR started an uptrend on 21st of October and formed a bullish channel. After several reactions to the top, base and of course the mid line of the channel the price is once more on the mid line. The overall look of the chart is bullish and in case the mid line resistance is broken, big ascending phase could be expected.
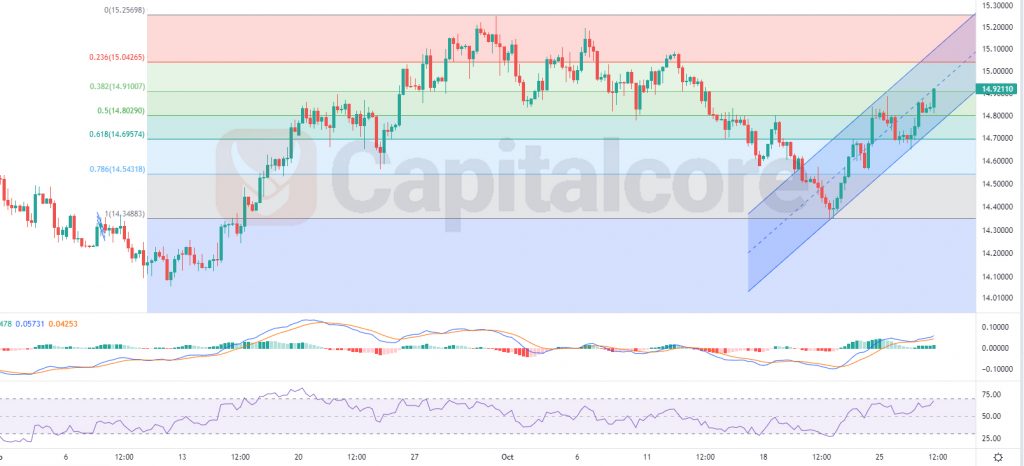
Chart Notes:
• Chart time-zone is UTC (+03:00)
• Candles’ time-frame is 4h.
Mid line of the channel equals to 0.5 level of the Fibonacci retracement. Both Fibo level and the dynamic resistance of the channel had been able to pump the price several times in the past. RSI indicator is getting close to 70 and bulls are currently holding power. In case the mid line of the channel can not stop the growth, buyers can target 15.04 as the first TP and 15.15 as the next one. On the other hand if the midline of the channel can resist once more, sellers can get in. The first TP that bears can aim for is 14.815 and the next one can be 14.7. Note that a retest of broken resistance or support is highly possible.
• DISCLAIMER: Please note that the above analysis is not an investment suggestion by “Capitalcore Ltd”. This post has been published only for educational purposes.