USD/ZAR at the bottom of the channel
USD/ZAR started a bearish trend on 15th of December and could descend more than 10.7% until 25th of March 2022, when the price line hit a support level and could ascend smoothly. Different bullish signals are being issued and buyers need to keep an eye on this pair.
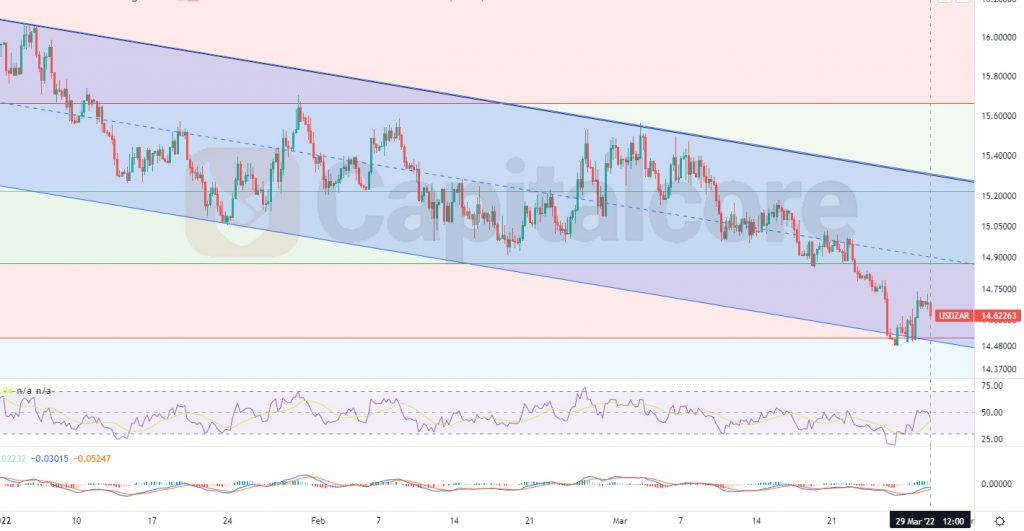
Chart Notes:
• Chart time-zone is UTC (+03:00)
• Candles’ time-frame is 4h.
The price line at the moment is showing 14.62263, which would be just above the base line of the descending channel as well as level 0.618 of the Fibonacci retracement on the previous major ascending wave. RSI is almost on 45 and has broken above the descending trend. MACD is showing weakness in ascending wave. The red zone on the chart indicates level 0.618 of the Fibonacci retracement, traders can be waiting for the price line to touch the bottom of this area once more and then they can enter long positions heading to 14.9, which would be level 0.5 of the Fibonacci, and also 15.1. Please consider that this theory would be of value as long as the price line has not broken below the channel majorly.
• DISCLAIMER: Please note that the above analysis is not an investment suggestion by “Capitalcore Ltd”. This post has been published only for educational purposes.