The price line, on the support zone
USD/ZAR started an ascending wave on 7th of June 2021 and the price ascended up to more than 22% until 26th November; then a descending wave started and caused the price to fall up to 7.6% . The price line right now is almost on the support level and the next few candles are of high importance.
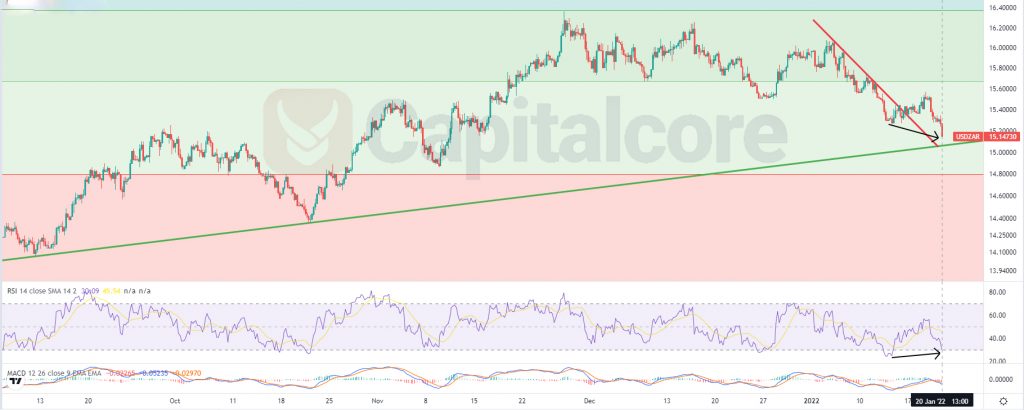
Chart Notes:
• Chart time-zone is UTC (+03:00)
• Candles’ time-frame is 4h.
The price at the moment is on 15.1473. The green line on the chart, indicates the support level that started forming on 7th of Jun. The red line shows the dynamic resistance that started forming on 26th of November and got broken on 17th of January 2022. At the moment the price line is retesting both the support and resistance level. RSI at the moment is almost on 30 and is issuing positive divergence. MACD is showing strong descending wave and has not issued any bullish signals yet. Buyers can be waiting to see how the price line reacts to the support level and in case there would be any bullish signal, they can enter long positions. The targets for the ascending wave could be considered on 15.6699 and 16. Seeing the price on 16.83 is also probable in the next few weeks. Please consider that, breaking below 14.799 would highly reduce the chance for the ascending wave.
• DISCLAIMER: Please note that the above analysis is not an investment suggestion by “Capitalcore Ltd”. This post has been published only for educational purposes.