Double top is about to be formed
USD/ZAR price line, broke below its ascending trend line on February 8th 2022; and then had a complex pullback to the broken trend line on 2nd to 16th of May, and then the price on this pair descended once more on 17th of may. The price line descended up to almost 6.9 % until 9th of June. The price line is now once more on a strong resistance and a bearish wave is potential to occur.
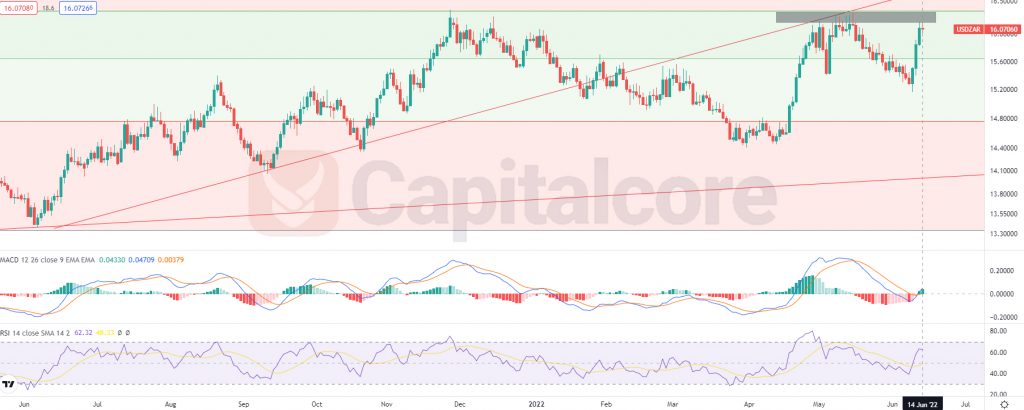
Chart Notes:
• Chart time-zone is UTC (+03:00)
• Candles’ time-frame is daily.
The price line is indicating 16.0706 at the moment which would be just below a valid resistance level. The resistance level has been indicated as a gray zone above the price line. The red ascending line on the chart, represents the bullish trend line which was broken on 8th of February; as you can see, several retests have been made to this trend line but the price line has not been able to break above this line yet. RSI is almost on 62 and has issued negative divergence signals. MACD is suggesting the commencement of a bullish wave. Traders can be waiting for any descending signals, then they can enter short positions, heading to 15.2 and 14.6.
please consider that, in case the price line breaks above the red line, the chance would be more with bulls, than bears.
• DISCLAIMER: Please note that the above analysis is not an investment suggestion by “Capitalcore Ltd”. This post has been published only for educational purposes.