The dynamic support is broken
USD/ZAR had been moving above a support level since 7th of June 2021 and could ascend more than 22% until 26th of November 2021. The price line has recently broken below the dynamic support and several descending signals have been issued. The overall look of the chart is bearish at the moment.
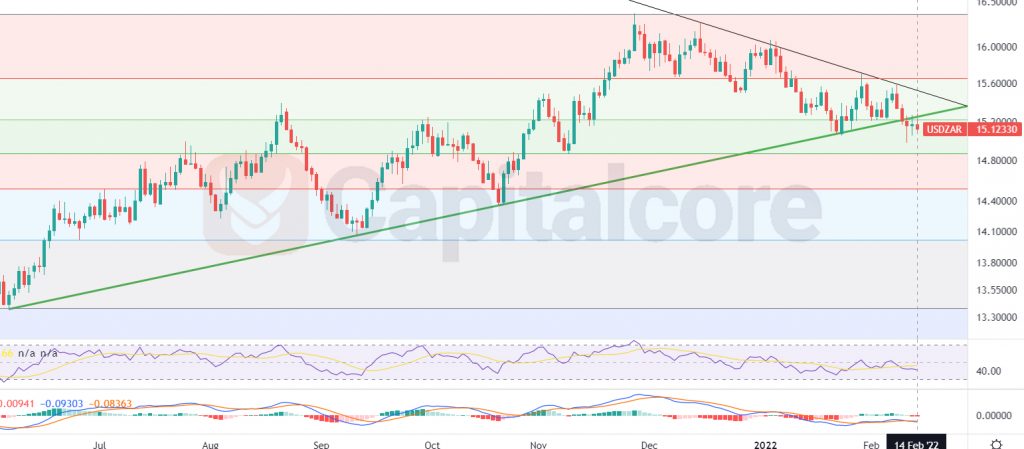
Chart Notes:
• Chart time-zone is UTC (+03:00)
• Candles’ time-frame is daily.
The price at the moment on USD/ZAR price chart is on 15.1233 which would be just below the broken support as well as level 0.382 of the Fibonacci retracement. The green line below the price line indicates the support line. The black line just above the price line indicates the dynamic resistance that has recently been formed. Traders can be waiting for the price line to have a retest of the broken dynamic resistance and in case they witness any descending signal, before the price line breaks above the back line, traders can enter short positions. The targets for the descending wave could be 14.58. Please consider that in case the price line breaks above the dynamic resistance, the chance of a descending wave to occur would highly reduce.
• DISCLAIMER: Please note that the above analysis is not an investment suggestion by “Capitalcore Ltd”. This post has been published only for educational purposes.