- September 29, 2021
- Category: Market News
A big step is expected
USD/ZAR broke out of the long term descending trendline after a long period. This break out occurred on 13th of July. The bullish power could not pump the price higher that 0.236 of the Fibonacci retracement; after that ascend, the price declined and retested of the broken trend line, then started another ascending step. right now the price is again on the 0.236 of the Fibonacci retracement.
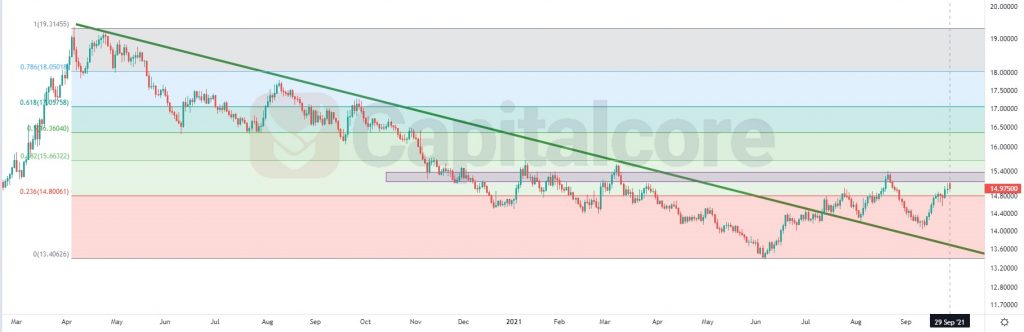
Chart Notes:
• Chart time-zone is UTC (+03:00)
• Candles’ time-frame is daily.
As the price action suggest, here two scenarios are possible. The first possible move of the price, would be another retest of the broken trendline. In this case sellers can target 14.3 as the first TP, and in case the bearish power is big enough to break this support, the next possible target would be 13.4 . The next scenario suggests that the bullish power can break the current resistance level, in this case buyers can target 15.65 as their first TP. 16.382 and 17 are the next possible targets for the ascending wave.
As the overall look of the chart and also different indicators suggest, bearish market is more possible in the next few days. 4h candles can trigger your buy or sell trade, so keep an eye on the chart.
• DISCLAIMER: Please note that the above analysis is not an investment suggestion by “Capitalcore Ltd”. This post has been published only for educational purposes.