USDCAD’s Ascending Channel Formation
The USDCAD currency pair appears to be in an ascending channel formation, indicating bullish momentum. The price is currently hovering near the upper trendline of the channel, hinting at potential resistance. Key Fibonacci retracement levels provide additional areas of interest, particularly around the 0.236 and 0.382 levels. Utilizing the Relative Strength Index (RSI) and the Moving Average Convergence Divergence (MACD) as technical indicators, we notice a positive divergence in the MACD and the RSI hovering around the mid-level, which could offer insights into future price movements.
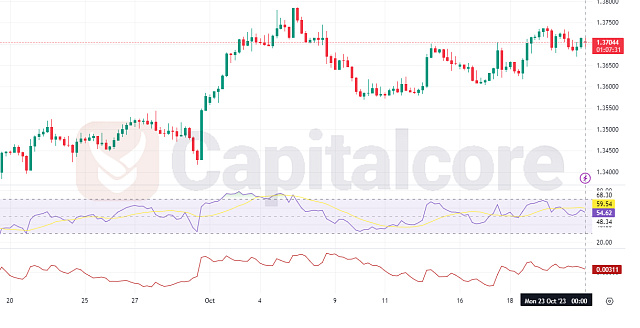
Chart Notes:
• Chart time-zone is UTC (+03:00)
• Candles’ time-frame is 4h.
Analyzing the USDCAD chart, the Relative Strength Index (RSI) is fluctuating near the mid-level, suggesting that the market is neither in a clear overbought nor oversold condition. The RSI’s movement close to the 50 mark indicates a balanced momentum without strong bullish or bearish bias at the moment. On the other hand, the Average True Range (ATR) appears relatively stable, suggesting that there hasn’t been a significant increase in volatility lately. A consistent ATR indicates that the market is trading within its usual range, and there hasn’t been any abrupt price movement. In summary, the combination of a balanced RSI and a stable ATR suggests a market in consolidation, awaiting a potential breakout or breakdown based on other influencing factors. Traders might want to monitor for any significant divergence in the RSI or a spike in the ATR, which could be early indicators of an impending price move.
Moreover, the proximity of the RSI to the mid-level suggests that traders are in a state of indecision, which could lead to range-bound trading conditions in the near term. However, any sharp movement away from this equilibrium, especially towards the overbought or oversold thresholds, could signify a momentum shift. As for the ATR, while it remains steady for now, any sudden spike might indicate a surge in trading activity, possibly fueled by external news or market events. It’s crucial for traders to remain vigilant and keep an eye on key support and resistance levels on the chart. In situations like these, where momentum is somewhat ambiguous, it’s often wise to await clearer signals or confirmation from other technical indicators before making trading decisions. This could help in gauging the direction of the potential breakout and capitalizing on it effectively.
• DISCLAIMER: Please note that the above analysis is not an investment suggestion by “Capitalcore Ltd”. This post has been published only for educational purposes.