Examining Key Indicators: Bollinger Bands & MACD
The USDCAD 4-hour chart provides a detailed glimpse into recent price action. Utilizing two prominent technical indicators, Bollinger Bands and the MACD, we can derive meaningful insights about potential future movements. Both indicators play pivotal roles in discerning market volatility and momentum.
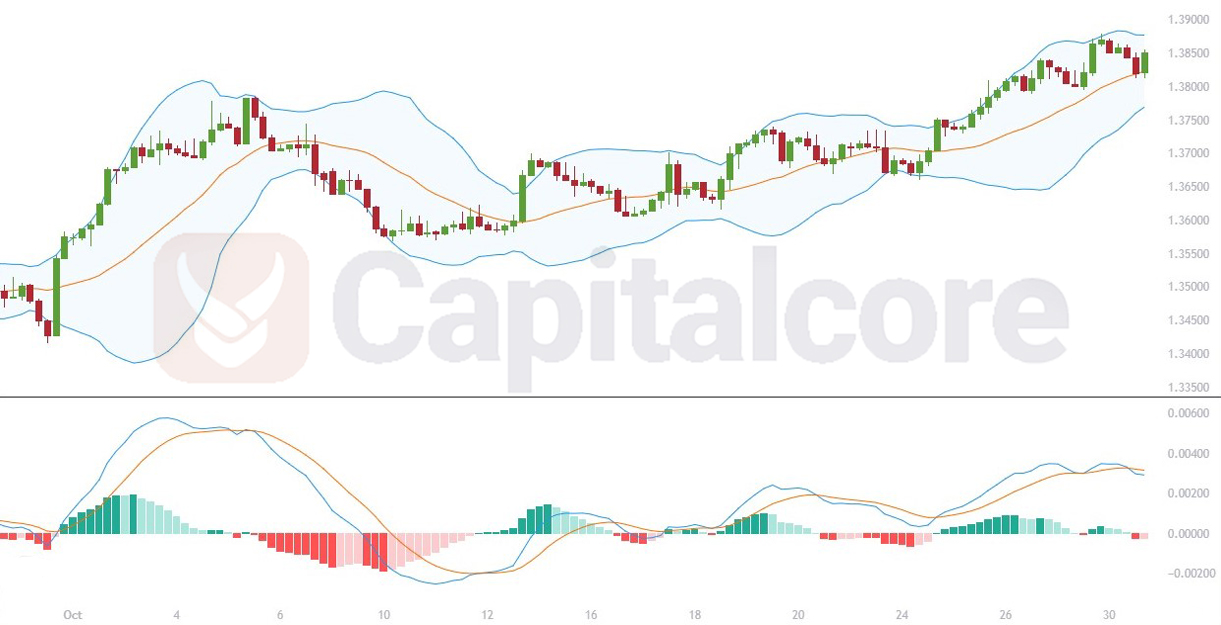
Chart Notes:
• Chart time-zone is UTC (+03:00)
• Candles’ time-frame is 4h.
The currency pair is oscillating near the upper Bollinger Band, suggesting a period of heightened volatility and a potential overbought condition. As for the MACD, a convergence of the MACD line with the signal line is noticeable, hinting at a potential trend reversal or deceleration in the bullish momentum. Past bullish crossovers are evident, with periods of sustained green histogram bars. However, a recent tapering in the histogram’s height suggests a weakening bullish momentum. Traders should be cautious; while the Bollinger Bands indicate potential retracement due to overbuying, the MACD suggests a potential slowdown in bullish momentum. A careful watch on these indicators might provide timely cues for entry or exit points.
• DISCLAIMER: Please note that the above analysis is not an investment suggestion by “Capitalcore Ltd”. This post has been published only for educational purposes.