USD/CAD Bears Eye Further Downside
The USD/CAD forex pair, often referred to as the “Loonie,” is currently exhibiting bearish tendencies as it remains constrained within a descending triangle pattern on the H4 candlestick chart. The Ichimoku Cloud on this forex pair has turned red, and the price has broken below the cloud, signaling a potential further downside. Additionally, the RSI indicator is trending below 50, which supports the bearish outlook on the Loonie. These technical indicators suggest that the USD/CAD pair might experience a decline in the near term. Traders observing USDCAD price movements should be mindful of these bearish signals and adjust their strategies accordingly.
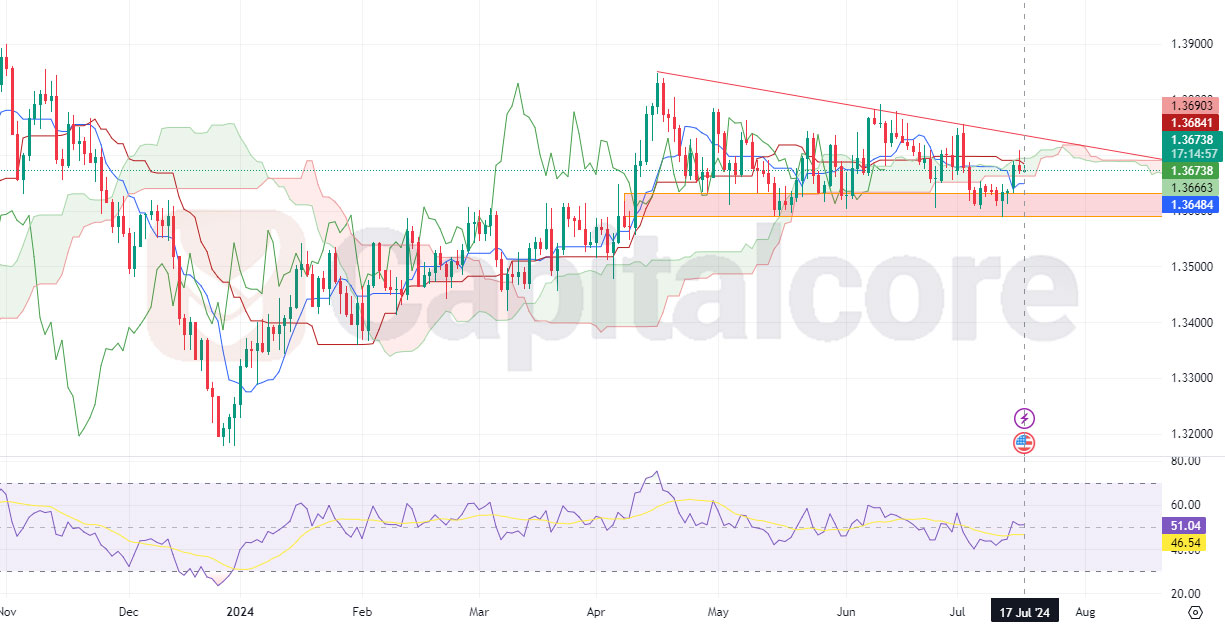
Chart Notes:
• Chart time-zone is UTC (+03:00)
• Candles’ time-frame is 4h.
Today’s economic releases and events are crucial for the USD/CAD pair’s price action. Canada will release its Foreign Securities Purchases data, which previously stood at 41.16B. For the US, significant data includes Building Permits and Housing Starts, both anticipated to have slight changes, and the Industrial Production m/m expected to decrease from 0.9% to 0.3%. Additionally, the speeches from FOMC members and the release of the Beige Book can create significant volatility. These fundamental factors, combined with the current technical analysis, could influence the USD/CAD trading signals and price prediction, potentially validating the bearish outlook for the Loonie. Traders should closely monitor these developments as they might present opportunities or risks for the USD/CAD forex pair.
• DISCLAIMER: Please note that the above analysis is not an investment suggestion by “Capitalcore Ltd”. This post has been published only for educational purposes.