USDCAD bullish outlook with upcoming CAD data
The USDCAD forex pair, often referred to as the “Loonie,” is a popular currency pair that represents the exchange rate between the US Dollar (USD) and the Canadian Dollar (CAD). As a commodity-based currency, the Canadian Dollar is closely tied to oil prices, while the US Dollar’s strength is influenced by macroeconomic factors. The upcoming CAD news, especially from Statistics Canada and CMHC regarding housing starts and consumer price indexes, is expected to drive volatility, especially since inflation and construction are key economic indicators.
From a fundamental perspective, the Canadian Dollar could strengthen today if housing starts data and inflation reports exceed forecasts, signaling a robust economy. On the USD side, traders will focus on retail sales and manufacturing production figures, which are key to gauging US consumer demand and inflationary pressure. If US data underperforms while Canadian data impresses, this may tilt the USDCAD pair toward further CAD gains.
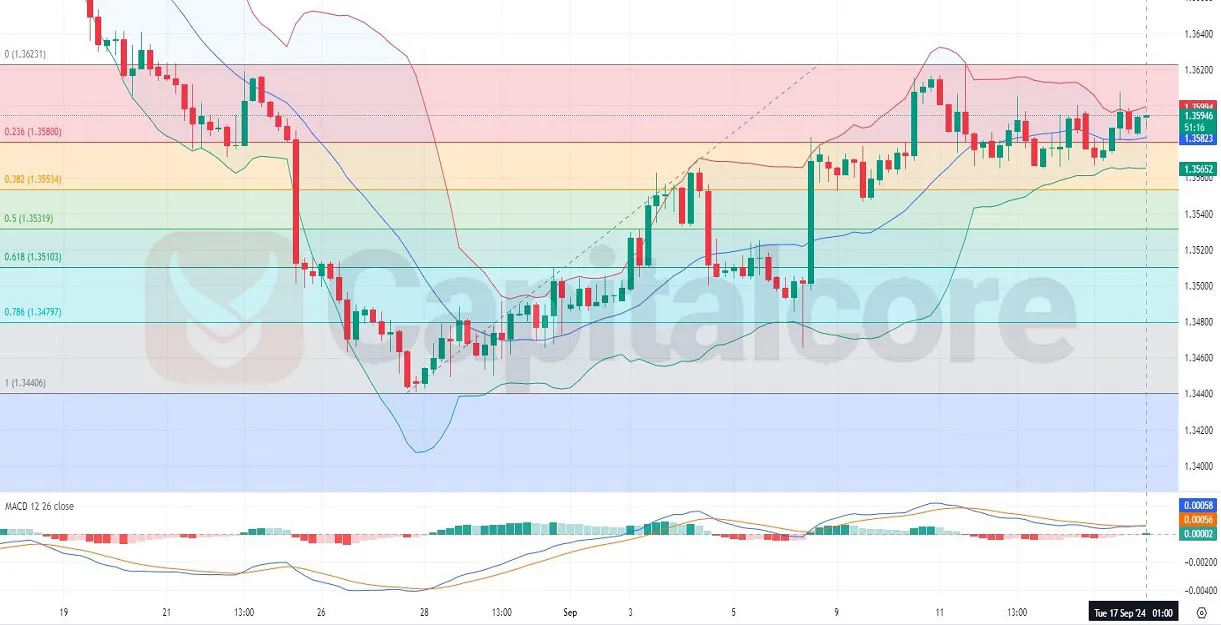
Chart Notes:
• Chart time-zone is UTC (+03:00)
• Candles’ time-frame is 4h.
Analyzing the USDCAD H4 chart, several technical indicators provide insights. The price has been in a slightly bullish trend, consolidating within the upper half of the Bollinger Bands, indicating upward momentum. The MACD histogram is showing a positive divergence, suggesting slight bullish pressure. The price is currently between the 0.236 and 0 Fibonacci retracement levels, hinting at potential resistance. However, if the bullish candles continue to dominate, a breakout above the 0.236 Fib level could push the pair higher.
• DISCLAIMER: Please note that the above analysis is not an investment suggestion by “Capitalcore LLC”. This post has been published only for educational purposes.