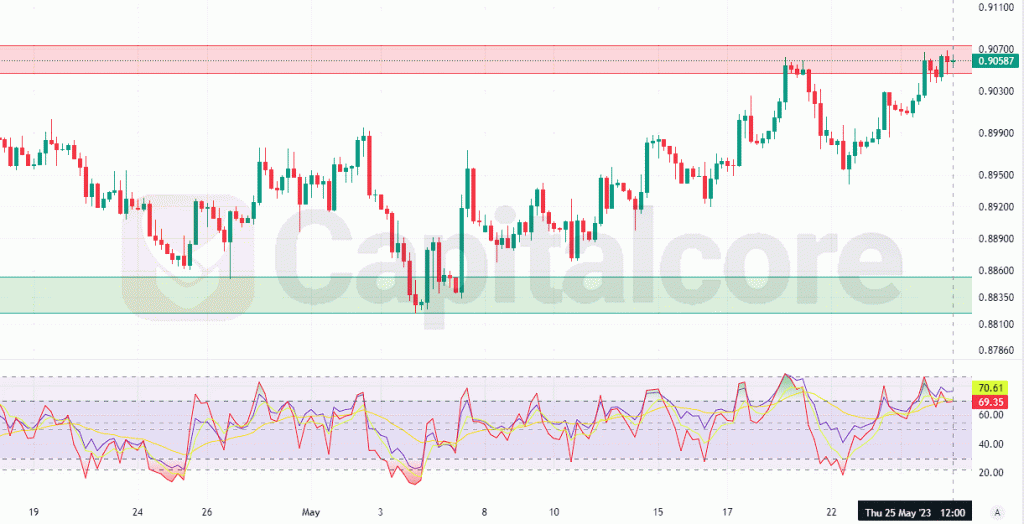
Downward Signals by RSI
The USDCHF currency pair is currently edging closer to a significant resistance level, signaling a potential barrier for further price gains. This impending resistance suggests that the market may face selling pressure, potentially causing a pause or even a reversal in the ongoing upward trend. Traders should exercise caution and closely monitor the price action as it interacts with this strong resistance zone.

Chart Notes:
• Chart time-zone is UTC (+03:00)
• Candles’ time-frame is 4h.
Adding to the bearish indications, the Relative Strength Index (RSI) is displaying signs of an overbought market. Elevated RSI levels typically indicate that the market has become overextended, raising the possibility of a corrective pullback. Furthermore, the RSI of the last 5 candles has broken below the RSI of the preceding 15 candles, which is often considered a bearish signal. This bearish divergence suggests a potential shift in market momentum, with shorter-term RSI readings indicating a weakening buying pressure compared to the longer-term RSI readings. In light of these factors, traders should be prepared for a potential bearish trigger that could initiate a downtrend in the USDCHF pair. The convergence of the price nearing a strong resistance level, the overbought RSI, and the bearish RSI divergence heightens the likelihood of a corrective move to the downside. It would be prudent for traders to monitor key support levels and wait for confirmation of a bearish trigger before considering any new trading positions.
• DISCLAIMER: Please note that the above analysis is not an investment suggestion by “Capitalcore Ltd”. This post has been published only for educational purposes.