USDJPY Ichimoku Cloud and RSI Trading Signals
The USD/JPY, often referred to as the “Ninja,” is one of the most actively traded forex pairs, representing the strength of the US Dollar against the Japanese Yen. This pair is heavily influenced by macroeconomic factors, central bank policies, and risk sentiment in global markets.
From a fundamental perspective, the USD JPY is currently driven by upcoming economic news from both the US and Japan. The latest release from the Federal Reserve Bank of Cleveland on inflation expectations will provide insights into how business managers forecast future price changes. A higher-than-expected outcome may strengthen the USD, as rising inflation expectations could push the Federal Reserve toward maintaining a hawkish stance. On the JPY side, the Bank of Japan’s bank loan data and the Adjusted Current Account from the Ministry of Finance will impact the yen. Stronger loan growth signals economic confidence, while a rising current account surplus would indicate stronger demand for JPY. If Japan’s trade and consumer sentiment data improve, it may provide support to the JPY, reinforcing its strength against the USD.
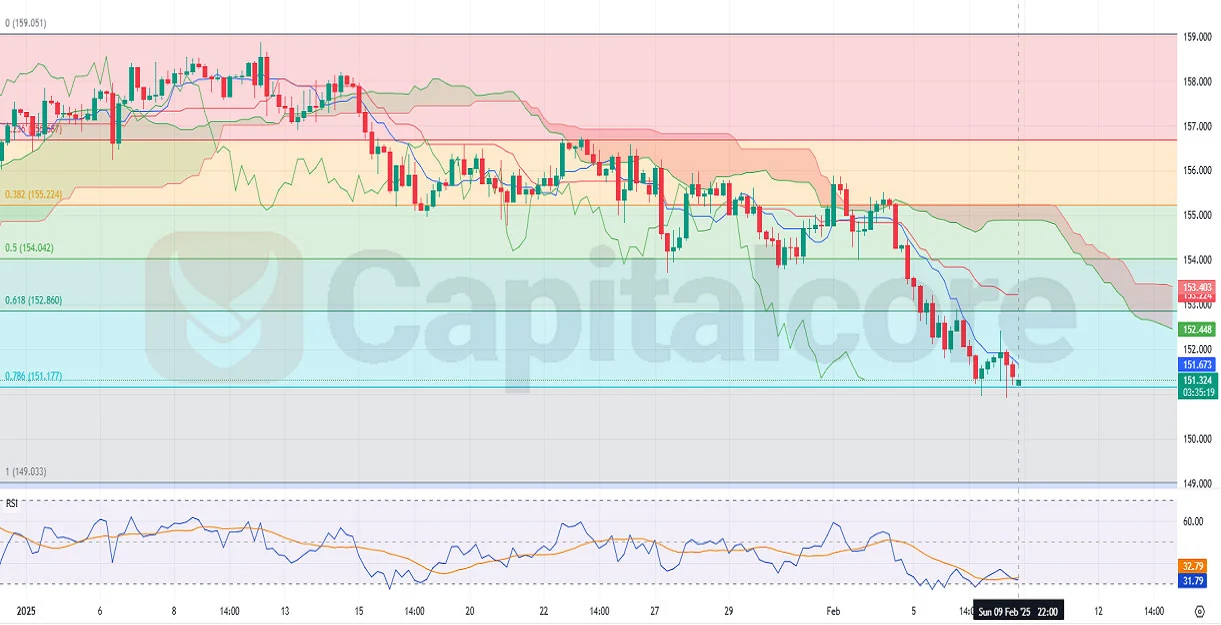
Chart Notes:
• Chart time-zone is UTC (+02:00)
• Candles’ time-frame is 4h.
Analyzing the USDJPY H4 chart, the Ichimoku Cloud and RSI indicators suggest a continuation of the bearish trend that has been in play since January 10th, 2025. The price has declined steadily from the 0 Fibonacci level down to the 0.786 Fib retracement, which is currently acting as a key support level. Notably, the latest H4 candle is green and positive, indicating that the price may be attempting a short-term correction after touching this key support zone. Additionally, the RSI-based Moving Average (MA) has crossed above the RSI blue line, signaling a potential reversal or consolidation. The RSI value remains in the lower range, hinting at oversold conditions, which could lead to a temporary retracement. However, the price is still trading below the Ichimoku cloud, confirming that the overall trend remains bearish unless a breakout above the cloud occurs.
• DISCLAIMER: Please note that the above analysis is not an investment suggestion by “Capitalcore LLC”. This post has been published only for educational purposes.