USDJPY H4 Technical Indicators Suggest Potential Reversal
The USDJPY forex pair, often referred to by its nickname “the ninja,” is one of the most actively traded currency pairs in the foreign exchange market. Known for its high liquidity and tight spreads, it represents the exchange rate between the US dollar (USD) and the Japanese yen (JPY). As a major currency pair, it is influenced by economic policies and geopolitical developments in both the United States and Japan.
Fundamentally, the upcoming news for today includes several events that could impact the USDJPY pair. FOMC members Bowman and Logan are expected to deliver low-impact speeches, which might provide subtle hints about future monetary policy. Additionally, President Biden’s announcement on his decision to drop out of the 2024 presidential race is expected to have a low impact. However, high-impact events such as the release of the Advance GDP q/q with a forecast of 2.0%, and Unemployment Claims forecasted at 237K, will be critical. These indicators reflect the overall economic health and labor market conditions in the US. An actual GDP figure above the forecast would be bullish for the USD, while lower-than-expected unemployment claims would also support the dollar. The Advance GDP Price Index and Core Durable Goods Orders m/m are medium-impact events that could further influence the market sentiment.
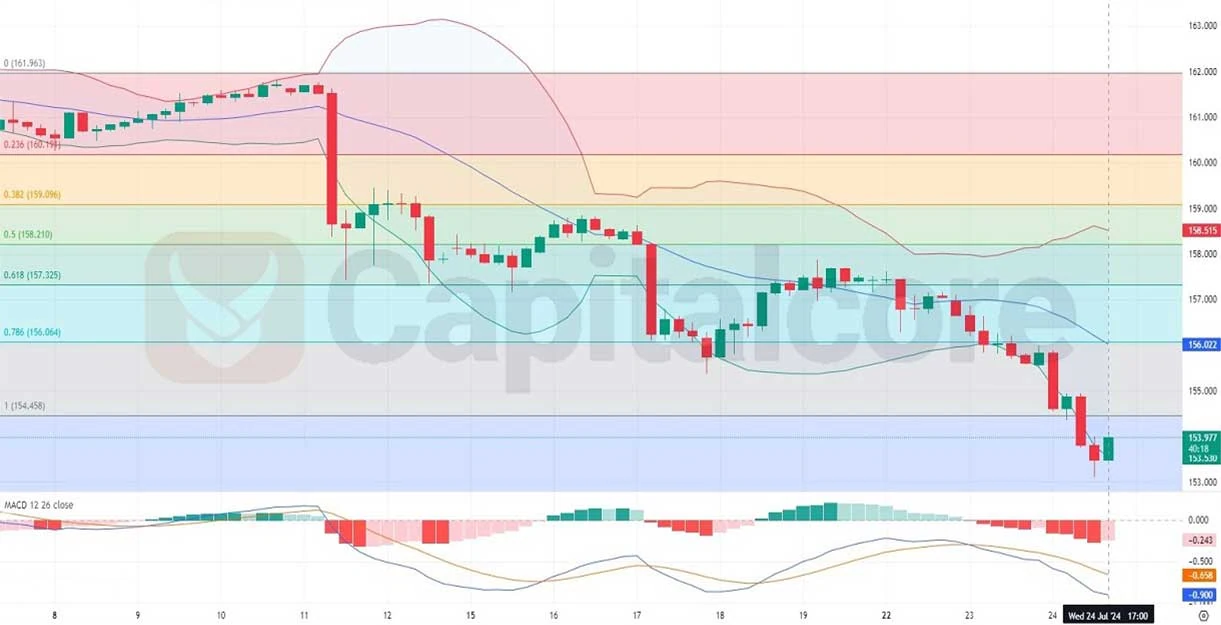
Chart Notes:
• Chart time-zone is UTC (+03:00)
• Candles’ time-frame is 4h.
Analyzing the USDJPY H4 chart, we observe that the price has been moving in the lower half of the Bollinger Bands, indicating a bearish trend. The bands have widened, reflecting increased volatility. However, the latest candle is green, suggesting a potential bullish reversal. The Fibonacci retracement levels show significant resistance and support areas, with the price recently bouncing off the 0.786 level. The MACD indicator shows that the MACD line has crossed below the signal line, confirming bearish momentum. However, the histogram shows a reduction in bearish momentum, aligning with the recent green candle, which could indicate a possible trend reversal.
• DISCLAIMER: Please note that the above analysis is not an investment suggestion by “Capitalcore LLC”. This post has been published only for educational purposes.