Trend reversal is about to take place
USD/JPY price line started a down trend after a strong descend. The down trend seems to be ending, the price is about to break out of the descending trend line, different indicators are issuing buy signal and overall look of the chart is bullish. An ascending wave looks to be approaching.
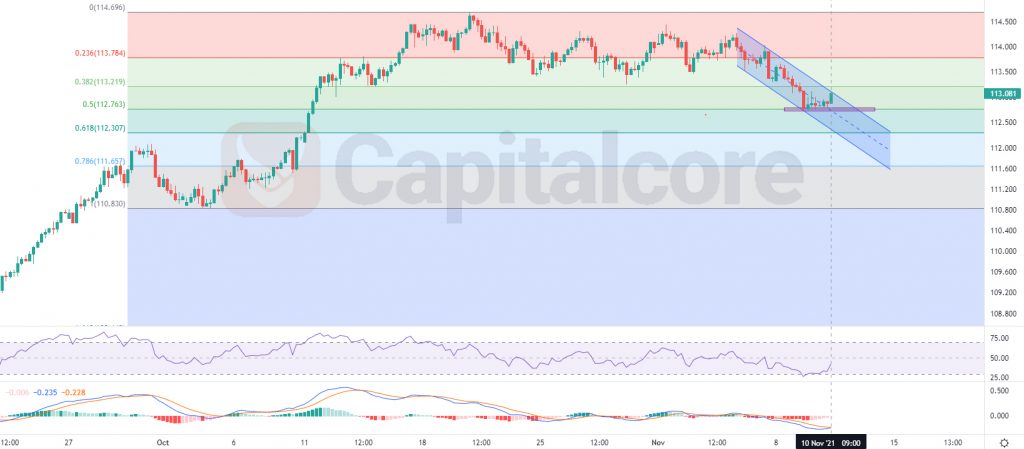
Chart Notes:
• Chart time-zone is UTC (+03:00)
• Candles’ time-frame is 4h.
The price line has formed a descending channel and after several reactions to the top and base of the channel, has reacted to a strong static support level at about 112.75. After that, the price started to grow to the top of the channel. At this moment the RSI indicator is below 50 and is issuing buy signal, as its heading to the higher half. MACD is also showing weakening of the ascending wave. In case the price line can break above the channel, buyers can expect an ascending wave heading to 113.5 . Please note that breaking below 112.65 at any point, will reduce the chance of an up trend.
• DISCLAIMER: Please note that the above analysis is not an investment suggestion by “Capitalcore Ltd”. This post has been published only for educational purposes.