USDJPY Technical Analysis: Bollinger Bands and Fibonacci Levels
The USDJPY forex pair, often nicknamed “The Ninja,” represents the exchange rate between the US Dollar and the Japanese Yen. As one of the most traded currency pairs in the forex market, it is known for its volatility and liquidity. Traders closely monitor this pair for its sensitivity to both US and Japanese economic indicators and geopolitical events.
Today, the USDJPY forex pair is expected to react to several key economic releases. The US Unemployment Claims report is anticipated with a forecast of 241K, which, if actual figures are lower, could be bullish for the USD. Additionally, the Final Wholesale Inventories and Mortgage Delinquencies reports, although of lower impact, will be scrutinized for signs of economic health. The upcoming 30-year Bond Auction and FOMC Member Barkin’s speech may also influence market sentiment. For Japan, the Bank Lending y/y, BOJ Summary of Opinions, and the Current Account report are on the docket, with the latter showing a forecast of 2.34T but an actual of 1.78T, which could weigh on the JPY. Traders will also watch the 30-year Bond Auction and Economy Watchers Sentiment report closely.
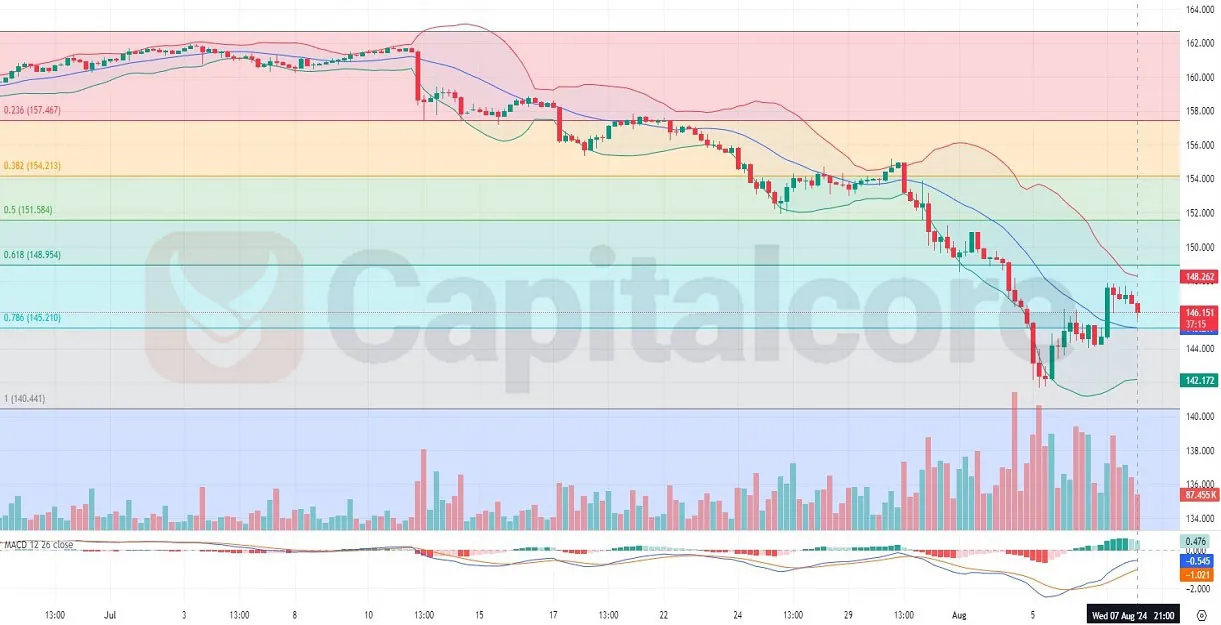
Chart Notes:
• Chart time-zone is UTC (+03:00)
• Candles’ time-frame is 4h.
Analyzing the USDJPY H4 chart, the price recently transitioned from a bearish trend to a more bullish stance. Over the last 15 candles, there has been a shift with 7 bullish (green) candles, indicating potential bullish momentum. The price has moved from the lower Bollinger Band towards the upper band, passing the middle band and currently fluctuating near the middle and upper bands. The USDJPY price is currently situated between the 0.618 and 0.786 Fibonacci retracement levels, suggesting key support and resistance zones. The MACD and histogram indicate a potential shift in momentum, further supporting the bullish outlook. However, traders should remain cautious as the price nears critical levels that could determine future trends.
• DISCLAIMER: Please note that the above analysis is not an investment suggestion by “Capitalcore LLC”. This post has been published only for educational purposes.