- September 9, 2024
- Posted By: james w
- Category: Market News
USDJPY Continues Bearish Channel Formation
The USDJPY forex pair, commonly referred to as “The Ninja,” is known for its volatility and is a major currency pair in the global foreign exchange market. It represents the strength of the US Dollar (USD) against the Japanese Yen (JPY), making it sensitive to economic indicators from both Japan and the United States. As of today, traders are eyeing key economic data from Japan, including the Bank of Japan’s release on outstanding loans, the current account figures from the Ministry of Finance, and quarterly GDP data, all of which can influence the JPY. In the US, wholesale inventories and consumer credit data are expected, potentially impacting the USD. These reports, especially the GDP and loan data, could cause fluctuations in the USDJPY, as they reflect consumer confidence and economic growth in Japan, while inventory data may signal shifts in business spending in the US.

Chart Notes:
• Chart time-zone is UTC (+03:00)
• Candles’ time-frame is 4h.
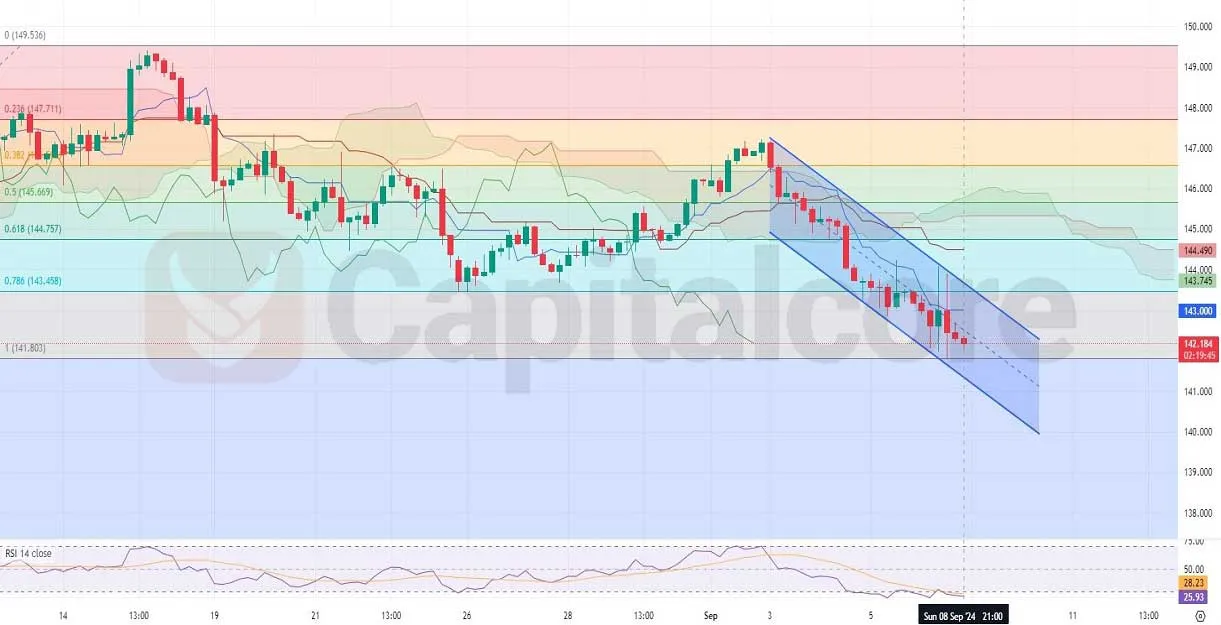
Analyzing the USDJPY H4 chart, we see a clear bearish trend, reinforced by the price being below the Ichimoku cloud, a strong indicator of downward momentum. The recent Fibonacci retracement levels further highlight the price’s fall below the 0.786 level, which suggests that a deeper retracement might be underway. The chart shows that 7 of the last 10 candles are bearish, with the last three continuing this pattern, signaling strong selling pressure. The RSI indicator is also trending lower, currently below 30, which suggests oversold conditions, though there may still be room for further downside movement. Overall, the USDJPY’s technical indicators point to continued bearish momentum in the short term, with potential support around the 1 Fibonacci level.
• DISCLAIMER: Please note that the above analysis is not an investment suggestion by “Capitalcore LLC”. This post has been published only for educational purposes.