The pair seems to be losing more
In recent years, the cryptocurrency market has experienced significant growth and volatility, with many traders and investors seeking to profit from the price movements of digital currencies such as Bitcoin, Ethereum, and others.
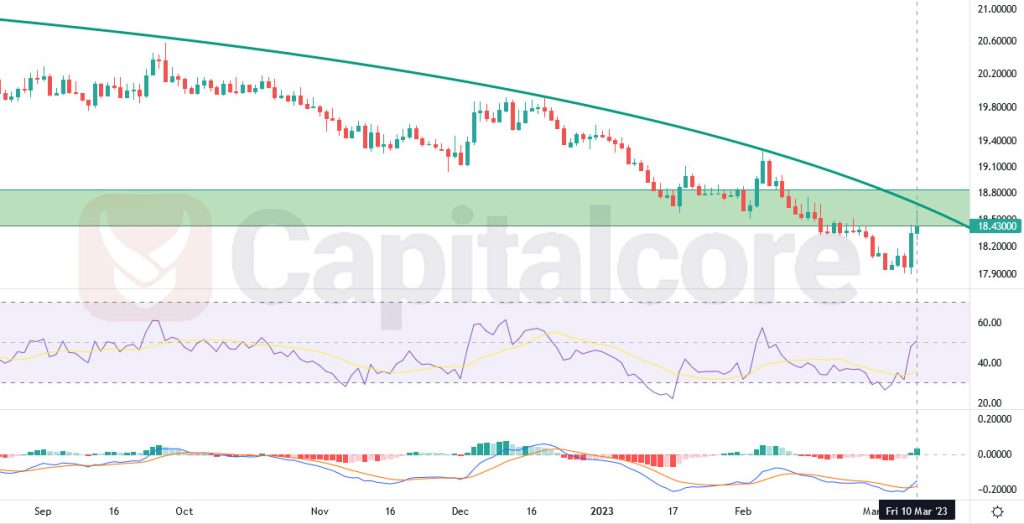
Chart Notes:
• Chart time-zone is UTC (+03:00)
• Candles’ time-frame is 4h.
. While this market can be exciting and potentially profitable, it’s also important to understand the risks and challenges involved in trading cryptocurrencies. One of the most significant of these challenges is the issue of liquidity, which can have a significant impact on prices and trading volumes. Regenerate response. USDMXN is the currency pair representing the US Dollar against the Mexican Peso. In recent market action, the price line for USDMXN has broken below a very strong support zone, signaling a potential shift towards a bearish phase. After retesting the support zone, the green line on the chart indicates an increasing slope of the bearish wave. This suggests that the currency pair may be experiencing downward pressure, and traders may be looking to sell USDMXN in anticipation of further losses. As with any financial market, there are always potential risks and uncertainties, so it’s important for traders to keep a close eye on the latest news and developments to stay informed and make well-informed trading decisions.
• DISCLAIMER: Please note that the above analysis is not an investment suggestion by “Capitalcore Ltd”. This post has been published only for educational purposes.