A strong descending wave looks close
NZD/CAD has been descending within a bearish channel since 25th of February 2021. On 31st on January 2022, the price line, after touching the base line of the channel, could ascend up to 5.6% and reached out to the top line on the channel. At the moment, the price line at the moment is approaching to a resistance level and a descending wave is potential to take place in the next few days.
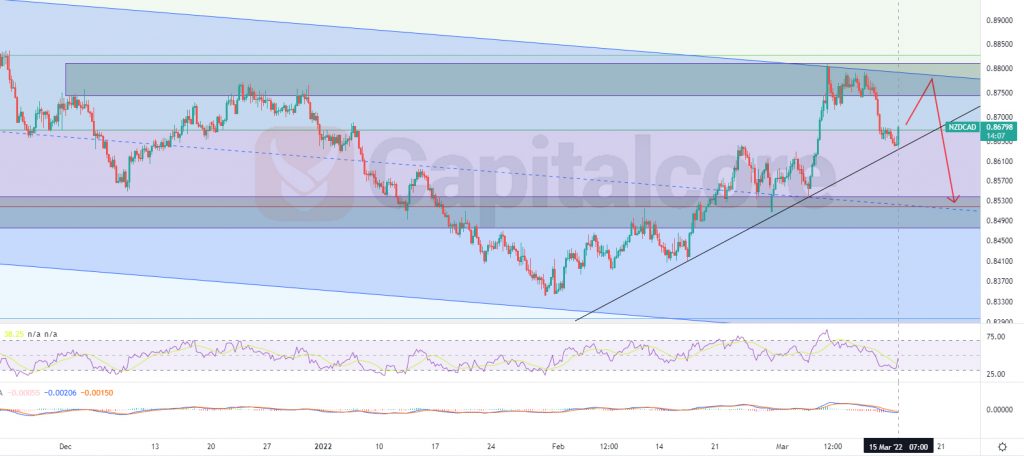
Chart Notes:
• Chart time-zone is UTC (+03:00)
• Candles’ time-frame is 4h.
The price line at the moment is showing 0.868. The black line on the chart indicates the trend line which was formed during the current ascending wave. RSI is almost on 40 and has issued positive divergence signal. MACD is showing weakness in the descending wave. There is a strong resistance level on 0.8742 – 0.88105, which has been shown as a grey zone on the chart; this zone is of high importance as it almost equals to level 0.382 of the Fibonacci retracement as well as the top line of the channel. The price line is moving towards this zone; Traders can be waiting for the price line to reach out to the resistance level and then they can enter short positions, heading to level 0.5 and 0.618 of the Fibonacci retracement, which are lying at 0.866 and 0.852. Note that the price line breaks above the top line of the descending channel, an ascending wave would be more probable than a descending one.
• DISCLAIMER: Please note that the above analysis is not an investment suggestion by “Capitalcore Ltd”. This post has been published only for educational purposes.