- June 7, 2023
- Posted By: capadmin
- Category: Market News
Breakout potential is witnessed
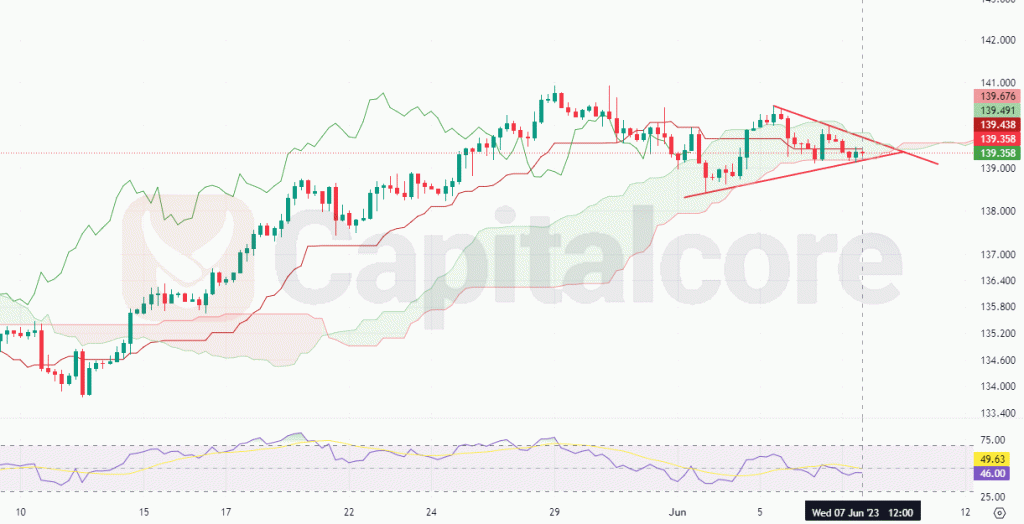
The USD/JPY currency pair is currently exhibiting some interesting technical patterns. First, the price line is positioned inside the Ichimoku cloud, which signifies a period of consolidation or indecision in the market. This suggests that buyers and sellers are relatively balanced at the moment, and a breakout from the cloud may indicate a potential shift in the overall trend.

Chart Notes:
• Chart time-zone is UTC (+03:00)
• Candles’ time-frame is 4h.
Additionally, the price line is forming a wedge pattern, characterized by converging trendlines that suggest a potential breakout in the near future. Wedge patterns can act as reversal or continuation patterns, depending on the prevailing trend. In this case, the price line was previously undergoing a bullish wave, which implies that a bearish breakout from the wedge pattern may be more likely. Supporting this bearish outlook, the Relative Strength Index (RSI) is currently in a bearish phase. The RSI measures the speed and change of price movements and provides insights into potential overbought or oversold conditions. The bearish phase of the RSI suggests that selling pressure may be increasing and that the price line could follow suit. Considering these technical indicators, it is expected that the USD/JPY price line may experience a downward movement in the near term. Traders and investors may consider monitoring the breakout from the wedge pattern and additional confirmations from other technical indicators before making any trading decisions. It is also important to stay updated on fundamental factors and market sentiment, as they can influence the price dynamics of the USD/JPY currency pair.
• DISCLAIMER: Please note that the above analysis is not an investment suggestion by “Capitalcore Ltd”. This post has been published only for educational purposes.