- Posted By: Lewis Miller
- Category: Market News
Entry Point After Price Pullback
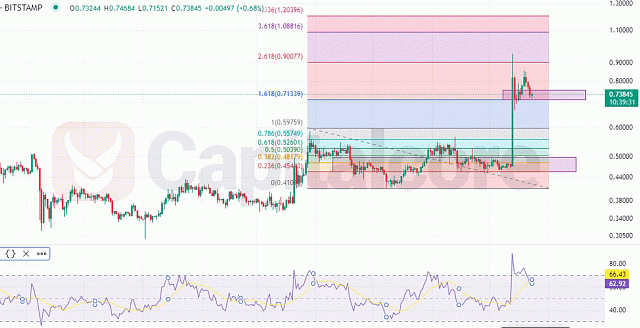
In this analysis of XRP, we are employing two powerful tools, RSI (Relative Strength Index) and Fibonacci retracement, to gain valuable insights into the cryptocurrency’s price movement. By utilizing the RSI, we can gauge the asset’s overbought or oversold conditions, helping us identify potential reversal points. Additionally, the Fibonacci retracement levels aid us in pinpointing critical support and resistance levels based on the historical price action. Presently, we are closely monitoring the price action as it approaches the 618 Fibonacci level, as this area often serves as a significant turning point for trends. Moreover, our attention is fixed on the resistance level, where the price may encounter barriers and potentially reverse its current direction. As we wait for these pivotal levels to come into play, we remain vigilant to capture potential trading opportunities and make informed decisions based on the price’s reactions.

Chart Notes:
• Chart time-zone is UTC (+03:00)
• Candles’ time-frame is 4h.
In this analysis, the RSI for XRP is indicating bullish momentum as it remains above the 60 percent level. Furthermore, the baseline cutting the RSI upwards suggests increasing strength in the uptrend. We are closely monitoring the price action as it approaches the critical 618 Fibonacci level, anticipating potential reactions and trend shifts. Additionally, our focus is on the resistance zone, observing candlestick patterns for an exit signal and possible price pullback, which could serve as an entry point for strategic trading decisions.
• DISCLAIMER: Please note that the above analysis is not an investment suggestion by “Capitalcore Ltd”. This post has been published only for educational purposes.