Ascending signals have been issued
On XRP/USD price chart, price is still consolidating after it broke above the descending trendline. XRP is now potential of finishing its descend trend soon and try to break it upside the flat resistance zone above it; the price can continue growing after that and have chances back to the resistance level.
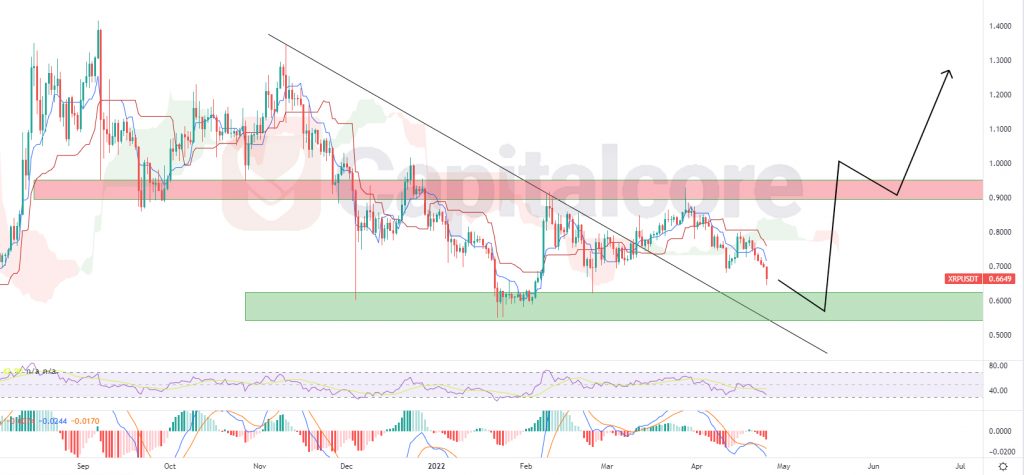
Chart Notes:
• Chart time-zone is UTC (+03:00)
• Candles’ time-frame is daily.
The price on XRP/USD chart is on 0.665 at the moment. The black line on the Chart, indicates the descending trend line. The price line could break above this area at 11th of March 2022. The green zone below the price line indicates a support level, which is expected to pump the price line once more after being touched. This level lays at 0.53 – 0.63. The red zone above the price line indicates the resistance level which has been formed while the market was ranging, since 28th of November 2021. Traders can be waiting for the price line to reach out to the support zone, then they can expect to see a bullish wave up to the resistance level, and if that level is broken too, the next target can be set on 1.2.
Please note that this theory is of value as long as the price line has not broken below the support zone.
• DISCLAIMER: Please note that the above analysis is not an investment suggestion by “Capitalcore Ltd”. This post has been published only for educational purposes.