Navigating the Ichimoku Clouds with XRPUSD
The XRPUSD pair has been showcasing a volatile journey on the H4 chart, navigating through significant price fluctuations and technical patterns. Traders are keeping a close eye on the developing trends for potential trading opportunities.
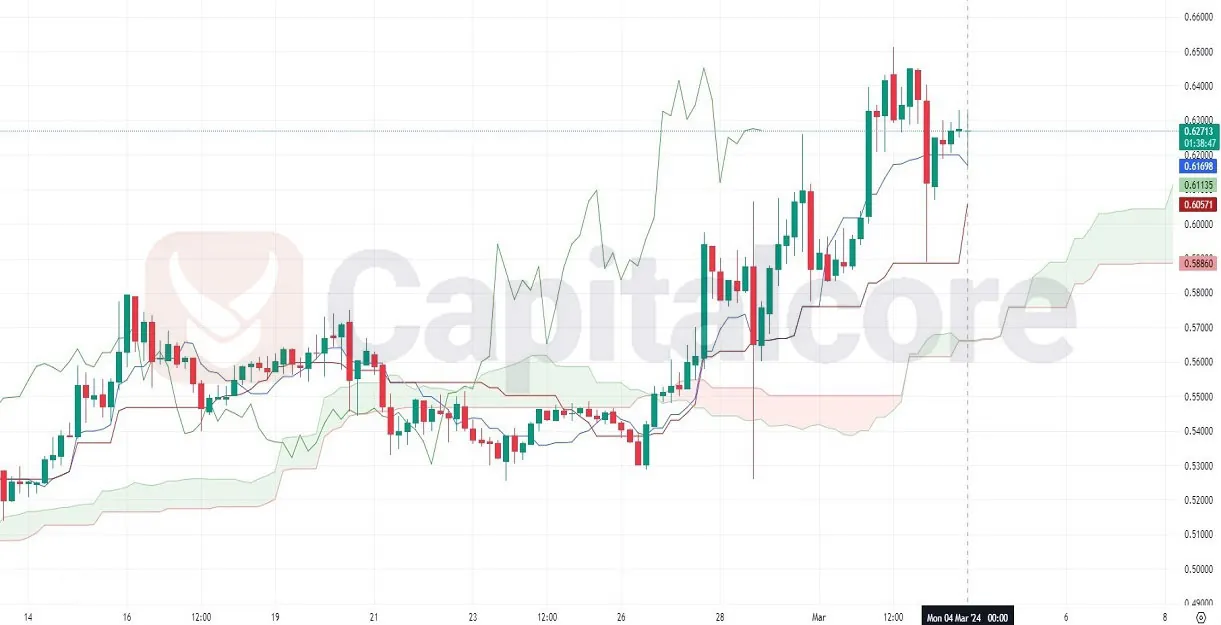
Chart Notes:
• Chart time-zone is UTC (+03:00)
• Candles’ time-frame is 4h.
On the H4 chart for XRPUSD, the price action has recently moved above the Ichimoku cloud, indicating a potential bullish trend. The Tenkan-sen (red line) appears to be trending above the Kijun-sen (blue line), which typically suggests positive momentum. However, the candlesticks are showing some resistance near the current levels, with wicks indicating selling pressure.
The Relative Strength Index (RSI) is not visible in the image provided, which is typically used to assess whether an asset is overbought or oversold. For a more comprehensive analysis, traders would look at the RSI and other momentum indicators.
Based on the current chart, the market sentiment appears cautiously optimistic, but traders might wait for a confirmation of a sustained trend above the Ichimoku cloud or for the price to retreat back to the cloud for support before taking a definitive position.
• DISCLAIMER: Please note that the above analysis is not an investment suggestion by “Capitalcore Ltd”. This post has been published only for educational purposes.