- June 5, 2024
- Posted by: Paris Blanc
- Category: Market News
GBPCAD Price Forecast: Analyzing Bullish Trends
On the GBPCAD H4 analysis for 6.5.2024, the Parabolic SAR indicator is positioned below the price, signaling a bullish trend and indicating that the market is in an uptrend. This suggests that the price is expected to continue rising. Additionally, the Moving Average (MA) is also below the price chart, further confirming the bullish trend. This alignment suggests that the current price is higher than the average price over the selected period, reinforcing the expectation of a continued upward movement.
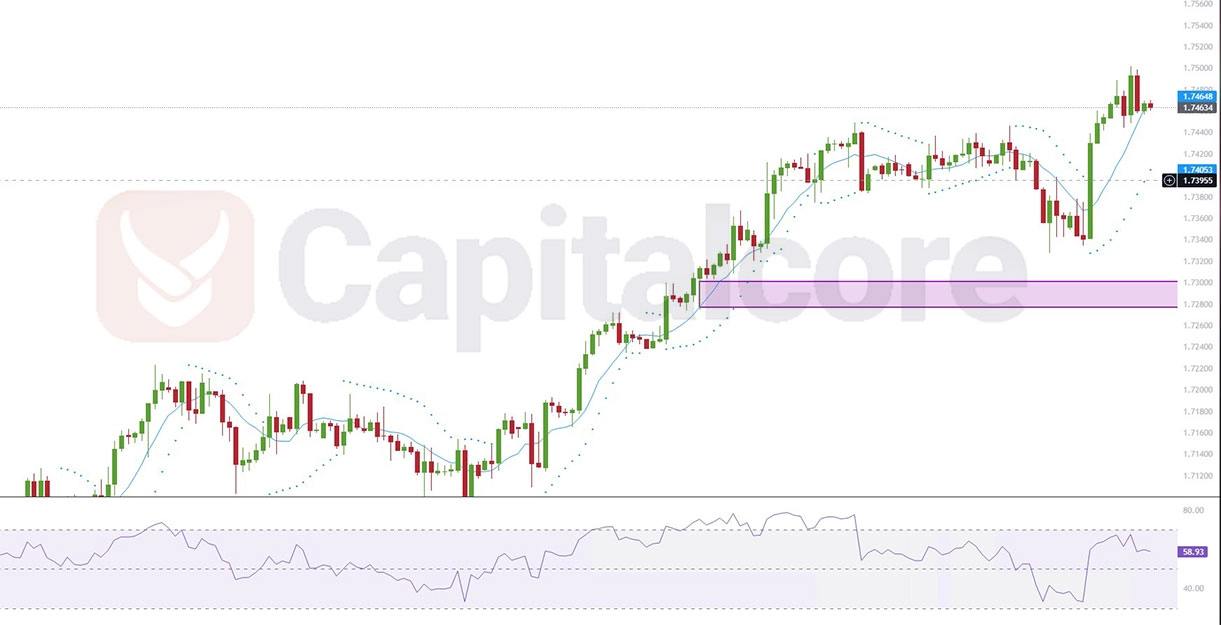
Chart Notes:
• Chart time-zone is UTC (+03:00)
• Candles’ time-frame is 4h.
For further confirmation, the Relative Strength Index (RSI) is around 58, which supports the bullish trend. This level of RSI suggests that the market has positive momentum and is not yet overbought, indicating room for further price increases. Given these technical indicators, it is anticipated that the price of GBPCAD will continue to rise. For more detailed insights and forecasts, keep an eye on the latest updates in GBP CAD technical analysis and GBP CAD analysis today.