- April 8, 2024
- Posted by: capadmin
- Category: Market News
Ichimoku and MACD: Bullish Duo
In this analysis, we will delve into the AUD/CAD currency pair, a fascinating matchup that pits the Australian dollar against its Canadian counterpart. This cross reflects the economic health and trading relationships between these two resource-rich countries. By examining the recent price action and utilizing the Ichimoku Cloud and MACD indicators, we aim to uncover potential trends and forecast possible movements that could aid traders in their decision-making.

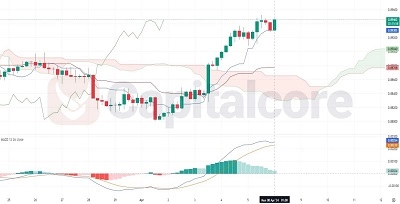
Chart Notes:
• Chart time-zone is UTC (+03:00)
• Candles’ time-frame is 4h.
The AUD/CAD pair shows a promising uptrend as evidenced by the recent bullish candlesticks stepping above the Ichimoku Cloud. The conversion line (blue) sits above the baseline (red), confirming the upward momentum. The green span of the cloud projects a supportive base, suggesting the path of least resistance is upwards. Notably, the MACD histogram displays increasing bullish momentum as the bars ascend above the baseline. The MACD line crossing above the signal line further bolsters the bullish outlook. However, traders should be cautious, as the proximity of the price to the upper edge of the cloud may indicate a potential resistance area. A watchful eye should be kept on the MACD for any signs of convergence that could signal a weakening trend.
• DISCLAIMER: Please note that the above analysis is not an investment suggestion by “Capitalcore Ltd”. This post has been published only for educational purposes.