- May 16, 2024
- Posted by: capadmin
- Category: Market News
Analyzing AUD/CAD with RSI and Bollinger Bands
The AUD/CAD currency pair represents the exchange rate between the Australian Dollar and the Canadian Dollar. This pair is influenced by economic data from both Australia and Canada, reflecting their relative economic health and commodity price fluctuations. Today, two high-impact news events are crucial for the AUD. Firstly, the Employment Change report showed an actual increase of 38.5K jobs versus the forecasted 22.4K, which is significantly positive for the AUD currency as job creation boosts consumer spending and economic activity. However, the Unemployment Rate came in higher than expected at 4.1%, compared to the forecast of 3.9%, indicating a slight increase in joblessness which can be negative for the currency. These mixed signals from the labor market can create volatility in the AUD/CAD pair.
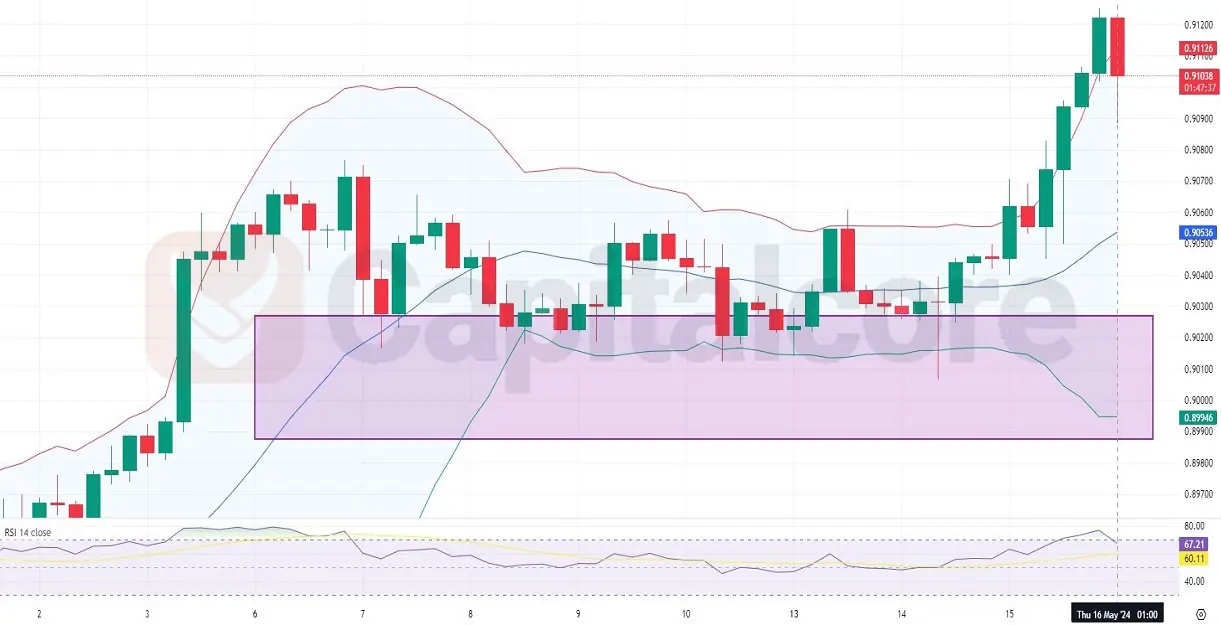
Chart Notes:
• Chart time-zone is UTC (+03:00)
• Candles’ time-frame is 4h.
On the forex AUDCAD chart H4, the last ten candles show a strong bullish trend with seven green candles. These candles have consistently been moving within the upper Bollinger Bands, indicating sustained upward momentum. The price action shows the pair riding the resistance line of the upper band, suggesting a strong buying interest. The Bollinger Bands are expanding, signaling increased volatility. The RSI is currently at 67.21, close to overbought territory, indicating potential for a reversal or consolidation if the buying pressure weakens.
• DISCLAIMER: Please note that the above analysis is not an investment suggestion by “Capitalcore Ltd”. This post has been published only for educational purposes.