- May 7, 2024
- Posted by: capadmin
- Category: Market News
AUD/USD Technical Analysis and Forecast
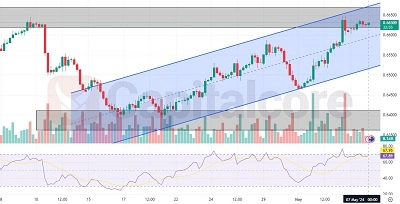
The AUD/USD currency pair is currently positioned at the upper boundary of a bullish channel, indicating a significant resistance level that could suggest a forthcoming trend reversal. Based on the analysis of recent AUDUSD price actions, there is a plausible shift towards a bearish trend, providing a prime entry point for bearish traders.
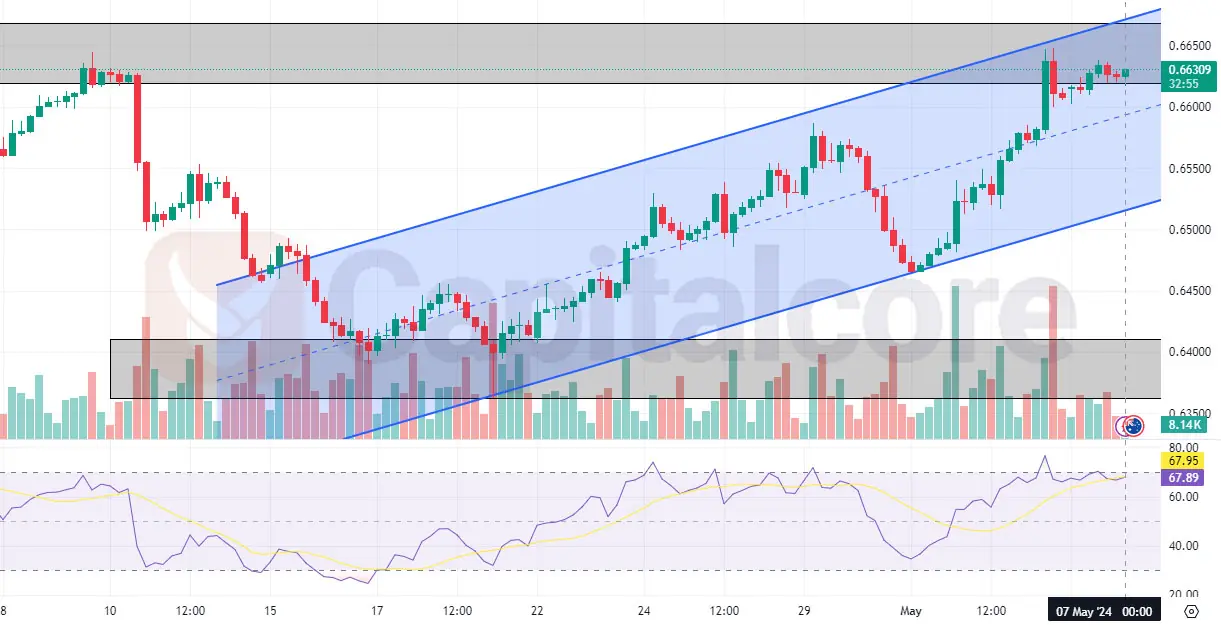
Chart Notes:
• Chart time-zone is UTC (+03:00)
• Candles’ time-frame is 4h.
This analysis draws upon various technical indicators that enhance the prediction of a potential downtrend. The Relative Strength Index (RSI) exhibits a negative divergence, a sign that the current AUDUSD bullish momentum might be losing strength despite the rising price action. Additionally, there is a noticeable decrease in trading volume, further supporting the likelihood of an impending bearish wave. The current market setup suggests that traders should be cautious and consider preparing for a possible decline in this pair. As the currency pair tests this critical resistance, the setup could indeed offer a valuable opportunity for those looking to capitalize on a potential downturn in the market.
• DISCLAIMER: Please note that the above analysis is not an investment suggestion by “Capitalcore Ltd”. This post has been published only for educational purposes.