- November 7, 2023
- Posted by: capadmin
- Category: Market News
AUD/USD Analysis: Ichimoku Signals
In the AUD/USD analysis, the Ichimoku Cloud indicator reveals a predominantly bullish sentiment. The last line of the Ichimoku Cloud is green, and the price candles are currently positioned above the cloud, indicating an overall bullish trend. However, it’s worth noting that the conversion line is currently tilting downwards and appears poised to intersect with the baseline, potentially signaling a weakening of bullish momentum.
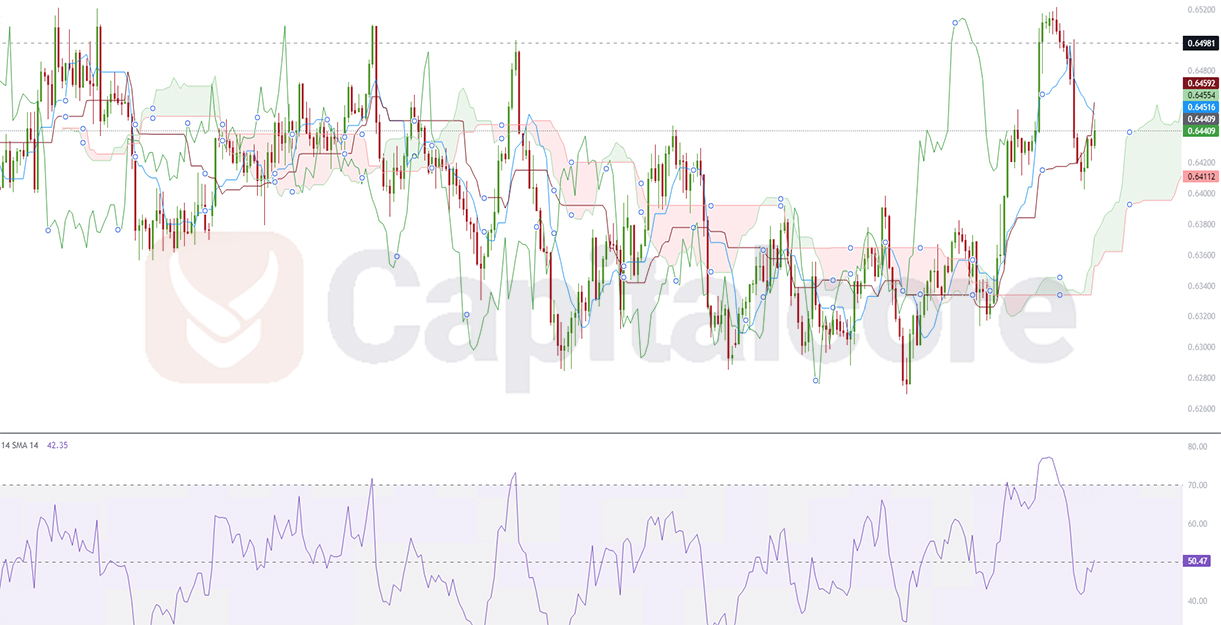
Chart Notes:
• Chart time-zone is UTC (+03:00)
• Candles’ time-frame is 4h.
The RSI (Relative Strength Index) at 51 suggests a neutral stance. In this condition, the market seems to be at a pivotal point, and traders may anticipate potential shifts in either direction as it seeks further direction and momentum.
• DISCLAIMER: Please note that the above analysis is not an investment suggestion by “Capitalcore Ltd”. This post has been published only for educational purposes.