- August 16, 2023
- Posted by: Lewis Miller
- Category: Market News
Decoding AUDCHF: RSI, SMA, and Trend
Introducing AUDCHF analysis: Amidst market shifts, the AUDCHF currency pair warrants scrutiny. Recent developments in key technical indicators are signaling potential shifts in market dynamics. Let’s delve into the RSI, SMA crossover, and overarching trend on the 4-hour timeframe to gain insights into the potential future direction of AUDCHF.

Chart Notes:
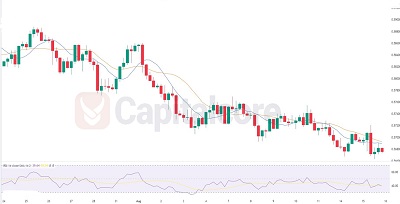
• Chart time-zone is UTC (+03:00)
• Candles’ time-frame is 4h.
In the AUDCHF pair, recent developments point towards potential bearish pressure. The Relative Strength Index (RSI) has gradually risen to 40, suggesting a moderate strengthening of buying interest but still within neutral territory. The crossover of the shorter Simple Moving Average (SMA) below the longer one could indicate a potential downtrend confirmation. The 4-hour timeframe also supports the bearish sentiment, aligning with a prevailing downward trend. Traders should keep an eye on how these technical indicators align with fundamental factors, and consider risk management strategies when evaluating potential short positions. As always, comprehensive analysis and careful consideration of various aspects are crucial for informed trading decisions.
• DISCLAIMER: Please note that the above analysis is not an investment suggestion by “Capitalcore Ltd”. This post has been published only for educational purposes.