- September 27, 2023
- Posted by: capadmin
- Category: Market News
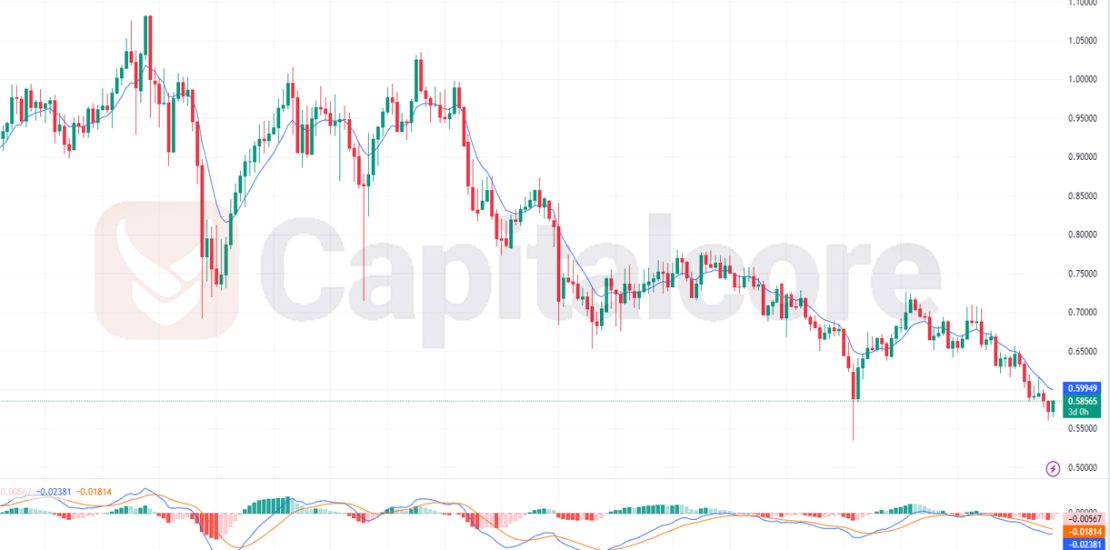
AUD/CHF: Using MA and MACD Indicator
The AUDCHF currency pair presents a noteworthy technical landscape. With the Moving Average (MA) positioning slightly above the price candles, this typically acts as a dynamic resistance level for the pair, hinting at potential bearish pressure in the near term. The MA hovering above often suggests the market may have difficulty rising further without a substantial change in underlying factors or sentiment.
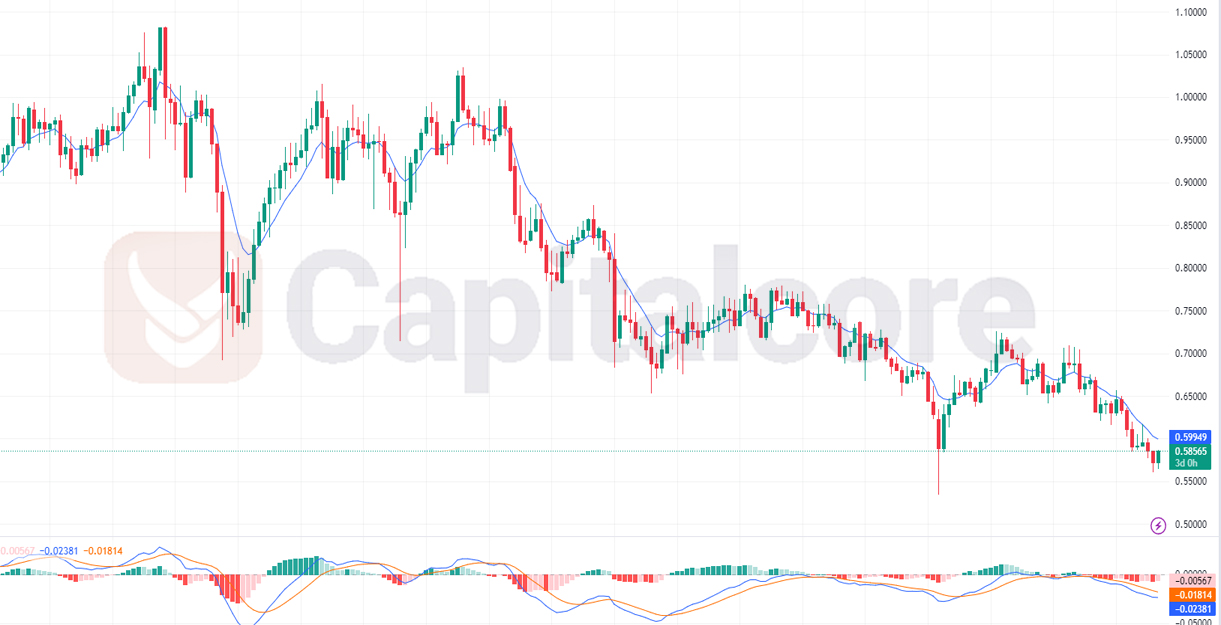
Chart Notes:
• Chart time-zone is UTC (+03:00)
• Candles’ time-frame is 4h.
Furthermore, the MACD indicator offers added perspective. Both the MACD signal and line being below the histogram, combined with red histogram candles, indicate prevailing bearish momentum. Historically, such configurations on the MACD often precede downward price movements. Investors should exercise caution and consider these signals when deciding on their next move, as they could imply a continued bearish trajectory for the AUDCHF pair in the upcoming sessions.
• DISCLAIMER: Please note that the above analysis is not an investment suggestion by “Capitalcore Ltd”. This post has been published only for educational purposes.