- October 3, 2023
- Posted by: capadmin
- Category: Market News
Bullish Momentum Faces Bearish MACD Pressure
The AUDCHF currency pair is currently navigating a predominantly bullish trend, but recent developments on the chart have raised some intriguing possibilities. As prices approach the lower band of the Bollinger Bands while the MACD bars exhibit strong bearish sentiment, traders are presented with a critical juncture where further analysis is required to determine the potential trajectory of this pair.
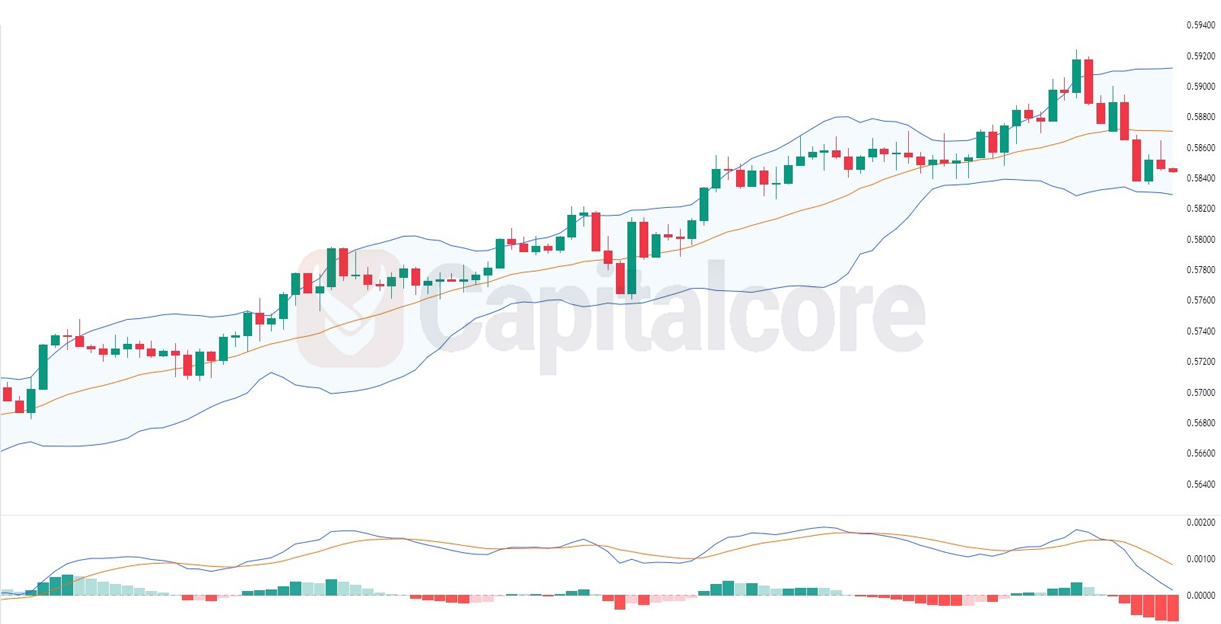
Chart Notes:
• Chart time-zone is UTC (+03:00)
• Candles’ time-frame is 4h.
The AUDCHF currency pair currently exhibits a predominantly bullish trajectory. The chart analysis reveals that prices are approaching the lower boundary of the Bollinger Bands, indicating a potential reversal or consolidation point. However, caution is warranted as the MACD histogram is displaying prominently red bars, signaling strong bearish momentum. This could suggest a temporary deviation from the overall bullish trend, potentially triggering a correction or retracement.
Traders should carefully monitor price action in this context, as a bounce off the lower Bollinger Band may still be in line with the broader bullish sentiment. Confirmation from other technical indicators, such as candlestick patterns or trendline support, would be prudent before making trading decisions. Additionally, keeping an eye on fundamental factors affecting the Australian and Swiss economies is essential for a comprehensive trading strategy.
• DISCLAIMER: Please note that the above analysis is not an investment suggestion by “Capitalcore Ltd”. This post has been published only for educational purposes.