- August 7, 2023
- Posted by: Lewis Miller
- Category: Market News
Deciphering AUDCHF’s Latest Technical Indications
In the latest 4-hour timeframe analysis of the AUD/CHF pair, several technical indicators suggest evolving market dynamics. A blend of patterns and signals is pointing towards an emerging optimism among traders. Here’s a comprehensive breakdown of these bullish signs and their potential implications.
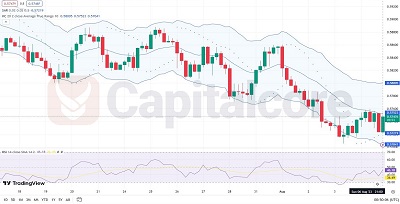
![]()
Chart Notes:
• Chart time-zone is UTC (+03:00)
• Candles’ time-frame is 4h.
The AUD/CHF pair presents a potential shift toward bullish sentiment. The parabolic SAR points below the candles signal a likely upward trend. This bullish indication is further reinforced by the chart’s touch on the KC indicator’s bottom line, followed by a reversal towards the channel’s midpoint. Additionally, the RSI line crossing over its MA suggests a change in momentum. Even though the RSI value of 46.18 isn’t traditionally bullish, the upward crossover from a low RSI-MA value of 36.49 indicates emerging bullish momentum. Collectively, these signals hint at a short-term bullish reversal. Traders should consider these positive signs but also remain alert for any changes in the trend or potential consolidation.
• DISCLAIMER: Please note that the above analysis is not an investment suggestion by “Capitalcore Ltd”. This post has been published only for educational purposes.