- November 10, 2023
- Posted by: capadmin
- Category: Market News
AUDJPY: The Bearish MACD Signal
The AUDJPY H4 chart captures the nuanced dance between the Australian Dollar and the Japanese Yen, two major currencies that reflect the economic interplay between Asia-https://capitalcore.com/wp-content/uploads/2023/11/AUDJPY-H4.jpgPacific dynamics and broader global market sentiment.
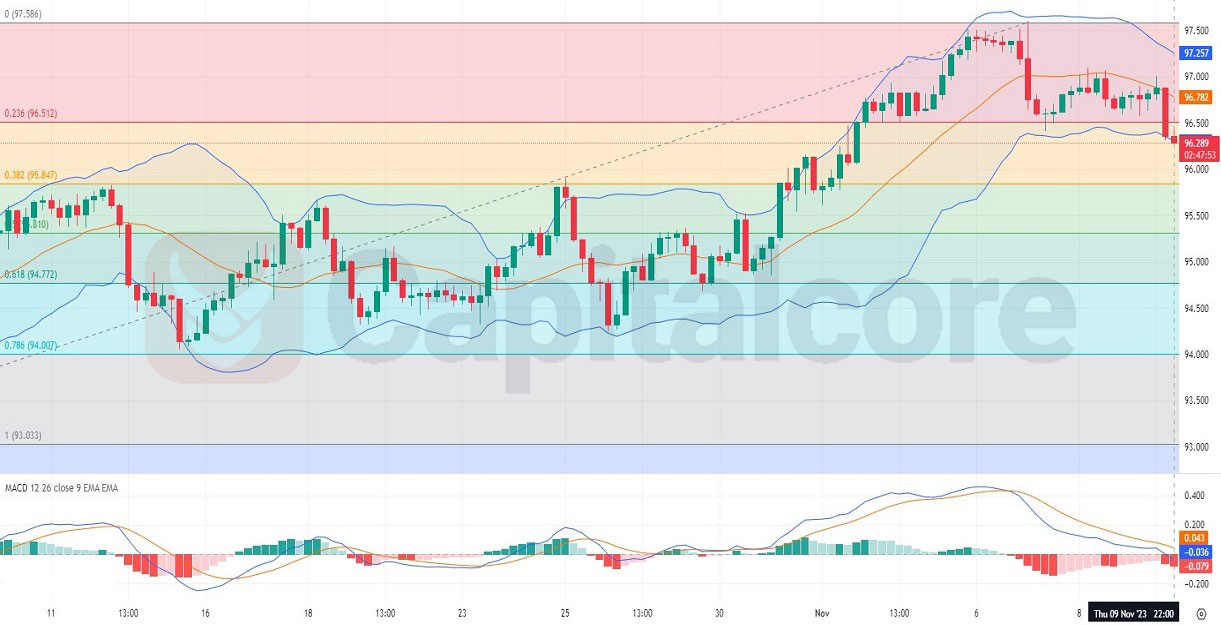
Chart Notes:
• Chart time-zone is UTC (+03:00)
• Candles’ time-frame is 4h.
The H4 chart for AUDJPY indicates a period of volatility and potential trend reversal. The price recently dipped below the middle Bollinger Band, suggesting a bearish shift in momentum. The MACD histogram is in negative territory, reinforcing the bearish sentiment as the MACD line has crossed below the signal line. Fibonacci retracement levels from a recent swing high to low show that the price is hovering around the 0.236 level at 96.512, which may serve as immediate resistance. The failure to breach this level might indicate a consolidation or further decline. Conversely, a break above could signal a return to bullish momentum. Traders should monitor these levels closely, as the price action near the Bollinger Bands and the MACD’s behavior will be telling of the pair’s next move.
• DISCLAIMER: Please note that the above analysis is not an investment suggestion by “Capitalcore Ltd”. This post has been published only for educational purposes.