- November 24, 2023
- Posted by: capadmin
- Category: Market News
Bearish Trend with Volatility Increase
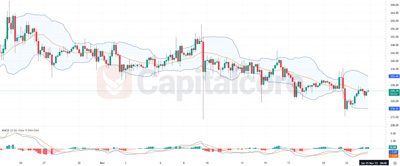
The BCHUSD chart shows a prevailing bearish trend as evidenced by the Moving Average Convergence Divergence (MACD) histogram situated below the baseline, indicating a dominant downward momentum. The Bollinger Bands display significant volatility with price frequently touching the lower band, further confirming the negative bias. Occasional price spikes towards the upper band suggest volatility, but these are met with resistance, leading to a continuation of the downtrend. The recent candles forming below the moving averages reinforce the bearish outlook, signaling limited bullish activity.
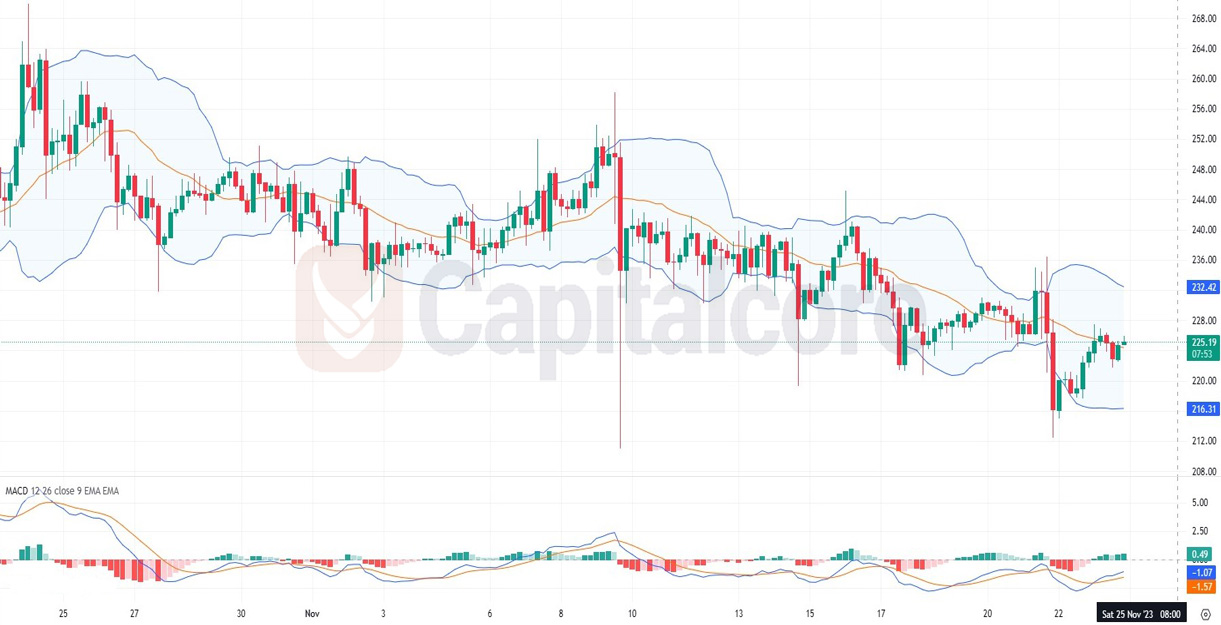
Chart Notes:
• Chart time-zone is UTC (+03:00)
• Candles’ time-frame is 4h.
In the BCHUSD trading pair, a series of red candles below both the short-term and long-term moving averages suggests a sustained bearish sentiment. The Bollinger Bands are widening, which typically signals increasing market volatility and potential for price fluctuations. The MACD’s position below the signal line and the appearance of bearish histograms accentuate the selling pressure. However, a few green candles indicate attempts at a reversal, though these appear to lack conviction as the price fails to breach the moving average resistance. Additionally, the MACD line is attempting to converge towards the signal line, hinting at a possible change in momentum. Traders should monitor for a confirmed crossover above the signal line, which could suggest a trend reversal, or continued histograms below the baseline, confirming the bearish trend.
• DISCLAIMER: Please note that the above analysis is not an investment suggestion by “Capitalcore Ltd”. This post has been published only for educational purposes.