- April 29, 2024
- Posted by: capadmin
- Category: Market News
BCH/USD Technical Outlook: Clouded Future
In the ever-evolving cryptocurrency market, BCH/USD represents an intriguing pairing for technical analysis. The chart indicates a challenging market with mixed signals, as traders attempt to decipher the future direction of Bitcoin Cash against the US Dollar. Below is a focused technical examination using the MACD and Ichimoku indicators to forecast potential market movements.
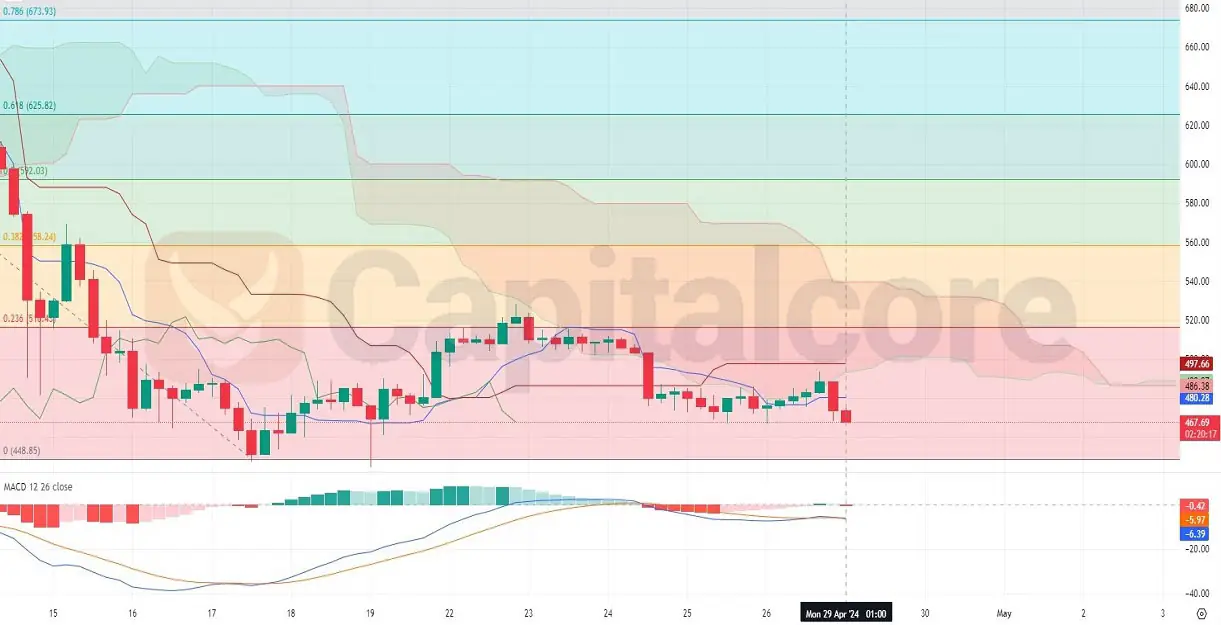
Chart Notes:
• Chart time-zone is UTC (+03:00)
• Candles’ time-frame is 4h.
The BCH/USD pair, as illustrated on the chart, has shown some volatility with the price movement fluctuating within the Ichimoku Cloud, which suggests a state of equilibrium or indecision among traders. The recent bearish candle indicates a negative shift in market sentiment. The MACD is currently positioned below the signal line and continues to trend downwards, suggesting bearish momentum. The histogram also reflects increasing bearish pressure as it dives deeper into the negative territory. However, the MACD line’s trajectory seems to be plateauing, hinting at a potential slowdown in selling pressure. The proximity of the price to the lower boundary of the Ichimoku Cloud may serve as a short-term support zone, but a definitive close below could spell further declines for BCH/USD.
• DISCLAIMER: Please note that the above analysis is not an investment suggestion by “Capitalcore Ltd”. This post has been published only for educational purposes.