- April 16, 2024
- Posted by: capadmin
- Category: Market News
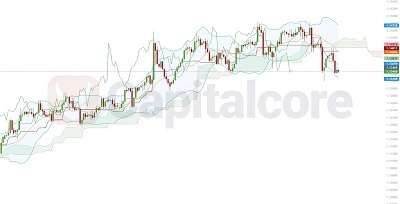
A Bearish Market Persists
The GBPCHF chart presents an interesting scenario, with price action currently below the Ichimoku cloud, suggesting a dominant bearish sentiment. This position beneath the cloud indicates that sellers are in control, signaling a potential continuation of the downtrend. The Bollinger Bands show that the price is hovering near the lower band, which often acts as a dynamic level of support. If the price sustains below this band, it could indicate further bearish momentum. Conversely, a bounce from the lower band could signal a retracement or a possible reversal if followed by significant bullish volume.

Chart Notes:
• Chart time-zone is UTC (+03:00)
• Candles’ time-frame is 4h.
Ichimoku and Bollinger Bands Insight:
The Ichimoku Cloud’s leading span is widening, which may imply increasing bearish volatility in the near term. Additionally, the lagging span is below the price line and the cloud, reinforcing the bearish trend. The convergence or divergence of the Bollinger Bands will provide further clues; a narrowing of the bands may precede a period of consolidation or a potential reversal, while expansion could signify continuing volatility and trend strength.
In summary, current indicators suggest that the GBPCHF is in a bearish phase, with the Ichimoku Cloud and Bollinger Bands aligning to this outlook. Traders should watch for the price’s interaction with the lower Bollinger Band and the Ichimoku Cloud for signs of either a strengthening downtrend or a forthcoming correction.
• DISCLAIMER: Please note that the above analysis is not an investment suggestion by “Capitalcore Ltd”. This post has been published only for educational purposes.